
Figure 8.
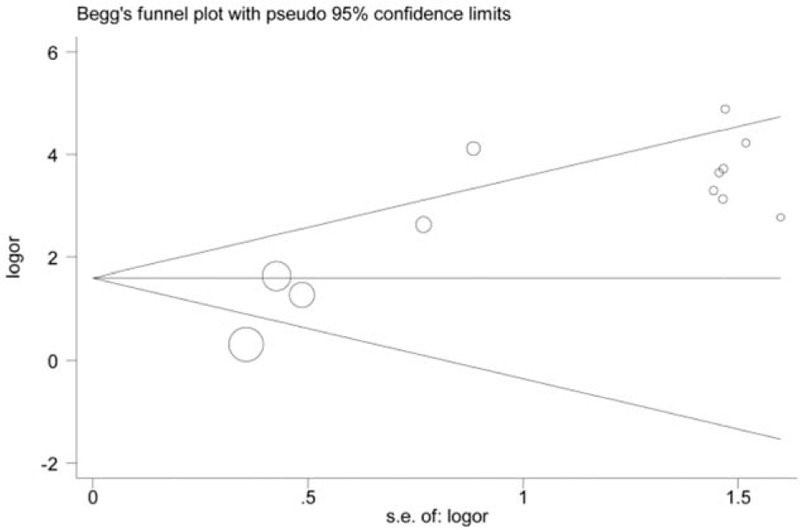
Funnel plot on association between CDH1 promoter hypermethylation and oral cancer risk (control vs case, unmethylation vs methylation). s.e.of: logOR, standard error of log OR. The funnel plot is applied to evaluate the publication bias among included studies. The horizontal axis represents the effect size of each included study. The area enclosed by the 2 diagonal lines simulates the 95%CIs. If the dot is located out the 95%CIs, publication bias may exist among studies. In addition, these dots that represent included studies should be symmetrical and be distributed on both sides of the angular bisector, which demonstrates no publication bias is found. From the funnel plot of Begg's test, we will acquire a P value. From the funnel plot, the P value was < 0.05. Therefore, publication bias may exist among these studies involving the analysis of association between CDH1 promoter hypermethylation and oral cancer risk. CDH1 = E-cadherin, log OR = log odds ratio, s.e.of: log OR = standard error of log odds ratio.