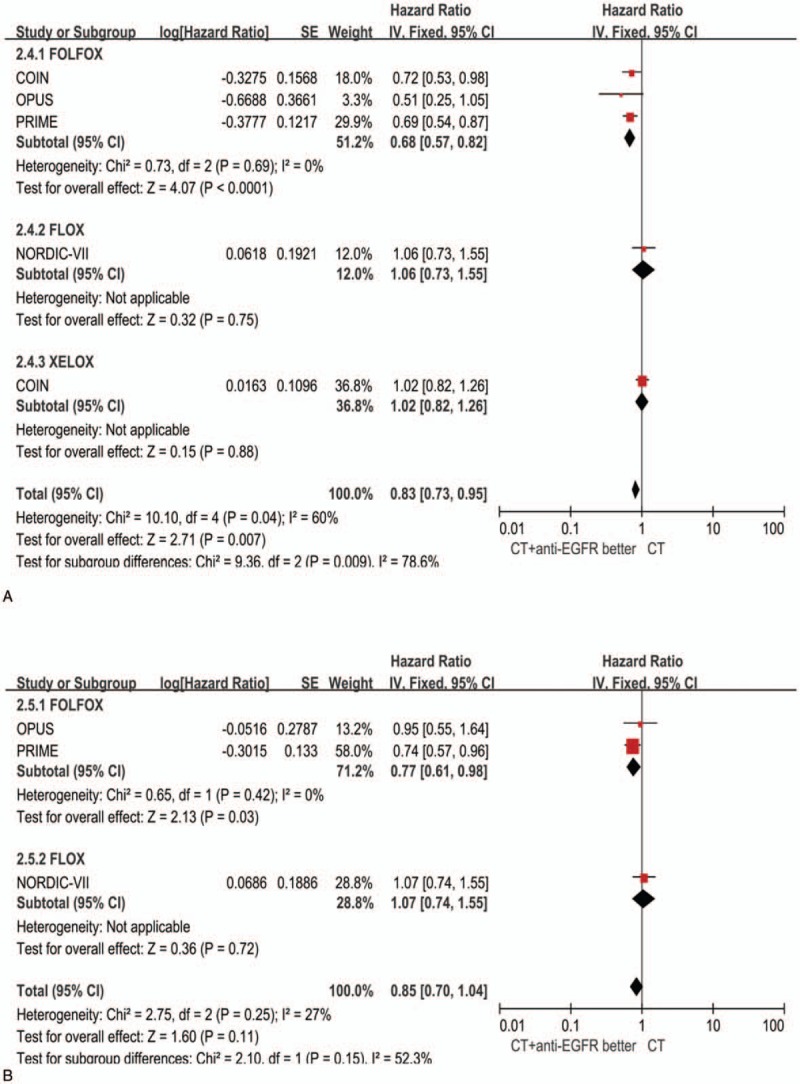
Figure 2.

Forest plots for predictive analyses in trials comparing chemotherapy plus EGFR antibody therapy with chemotherapy alone in RAS/BRAF wild patients. (A) progression-free survival, (B) overall survival. CI = confidence interval, CT = chemotherapy, EGFR = epidermal growth factor receptor, HR = hazard ratio, OR = odds ratio.
