Figure 2.

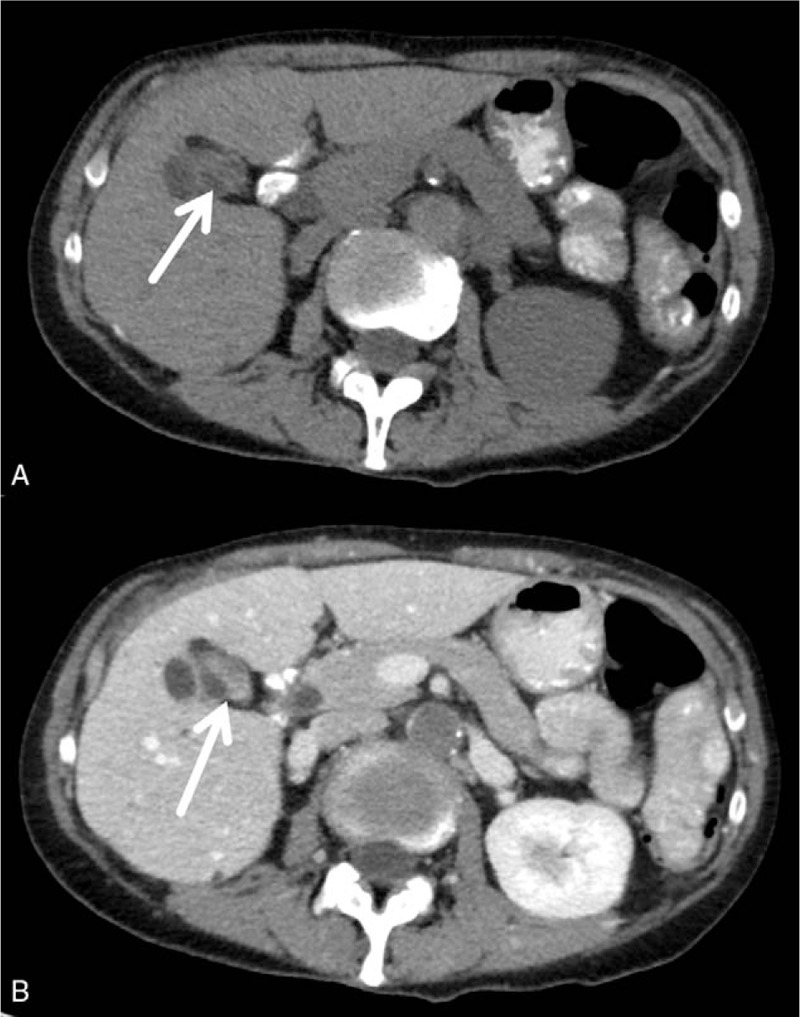
Computed tomographic (CT) findings. A—precontrast axial CT demonstrating a slightly hyperdense mass (arrow) in the gallbladder. B—postcontrast axial CT, showing a slightly enhancement of the lesion (arrow).

Computed tomographic (CT) findings. A—precontrast axial CT demonstrating a slightly hyperdense mass (arrow) in the gallbladder. B—postcontrast axial CT, showing a slightly enhancement of the lesion (arrow).