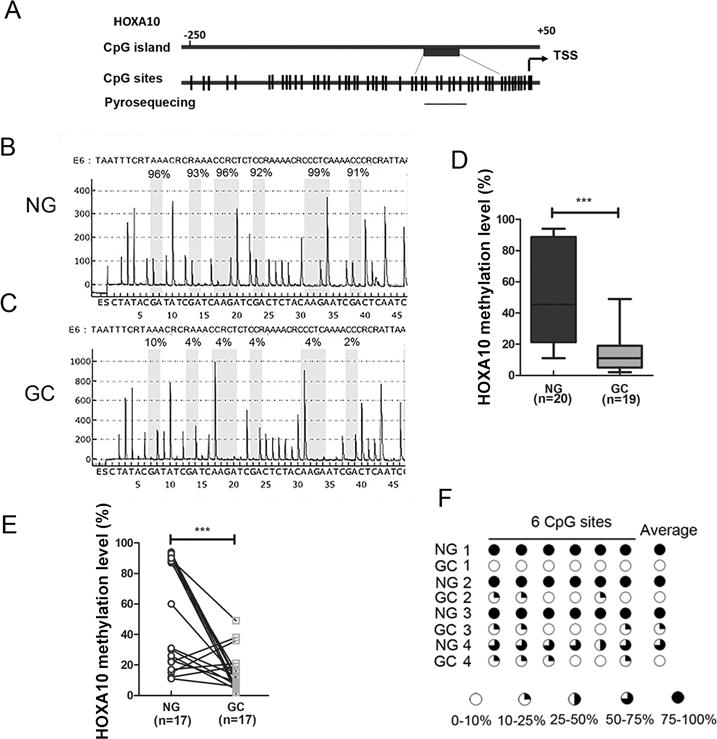
Figure 2. HOXA10 promoter is hypo-methylated in human GC samples.

(A) A schematic drawing shows CpG sites in HOXA10 gene promoter and pyrosequencing assay location. Each vertical bar represents a CpG site. TSS, transcription start site. (B) and (C) DNA methylation level of 6 CpG sites in the HOXA10 promoter were quantified by pyrosequencing. Representative pyrosequencing profiles of NG and GC samples are shown. (D) Quantification data of HOXA10 promoter methylation levels in 20 NG and 19 GC samples. The box-and-whisker plots are used to demonstrate the data. The lower and the upper edges of the box mark the 25th and 75th percentile, respectively. The areas between the box and the whisker extend to the 10th and 90th percentile. (E) HOXA10 promoter methylation level in 17 pairs of matched normal and gastric cancer samples. (F) A schematic profile shows HOXA10 promoter methylation level of 6 CpG sites in 4 pairs of matched representative patient samples. ***p<0.001.
