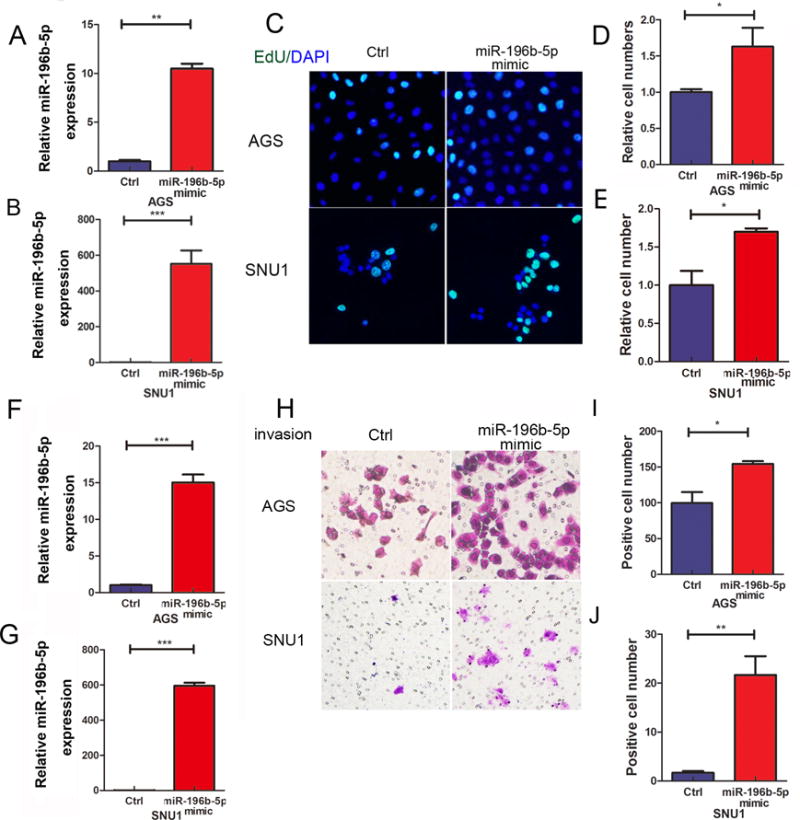
Figure 6. Reconstitution of miR-196b-5p promotes gastric cancer proliferation and invasion.

(A) and (B) qRT-PCR data of miR-196b-5p expression levels in AGS and SNU1 cells transfected with control or miR-196b-5p mimic. (C) EdU assay shows proliferating cells in AGS (upper panels) or SUN1 (lower panels) cells as in A and B. Green fluorescence staining indicates proliferating EdU positive cells. Blue staining represents a counterstain with DAPI for cell nucleus. (D) and (E) Quantification data of C. (F) and (G) demonstrate qRT-PCR data of miR-196b-5p expression levels in AGS and SNU1 cells transfected with control or miR-196b-5p mimic. (H) Transwell invasion assay in AGS and SNU1 cells as in F and G. (I) and (J) Quantification data of H. *p<0.05, **p<0.01, ***p<0.001.
