Figure 1.

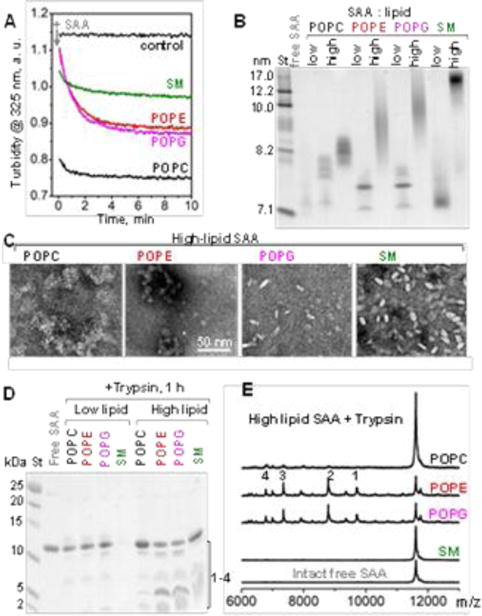
Formation and characterization of SAA:phospholipid complexes. (A) Clearance time course of MLVs by SAA at 24 °C monitored by turbidity. Arrow shows t=0 when SAA was added to MLVs at a 1:2 protein:lipid weight ratio. POPC MLV alone provided a control. (B) Non-denaturing PAGE of free SAA and its “low-lipid” and “high-lipid” complexes (see ESI Table S2). Lipid-fee SAA, which forms oligomers, is shown for comparison. (C) TEM of negatively-stained ”high-lipid” complexes. (D) SDS PAGE shows limited proteolysis of SAA in lipid complexes after 1 h of tryptic digestion. (E). MALDI-TOF mass spectrometry of the tryptic fragments generated using “high-lipid” SAA complexes. Intact free SAA is shown for comparison. The molecular mass of SAA fragments 1-4 observed in POPE and POPG complexes and the corresponding residue fragments were: 1) 9,714 Da (1-94), 2) 8,791 Da (1-76), 3) 7,348 Da (1-70), and 4) 6,336 Da (1-56).
