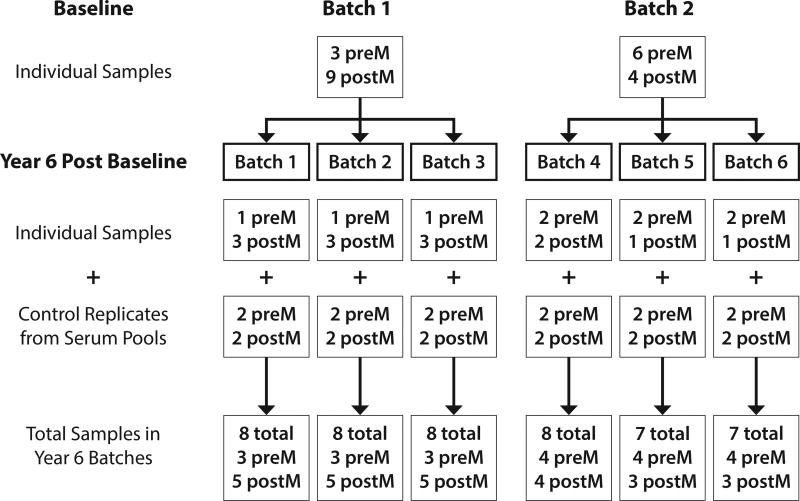
FIGURE 1. Design of Batches.
Schematic showing the study design, including 22 specimens from 22 women, 13 of whom were post-menopausal, assayed in two batches at baseline and in 6 batches 6 years later, each of which included 2 replicates of the pre-menopausal pool and 2 of the post-menopausal pool. The control pools were used to assess batch effects.

