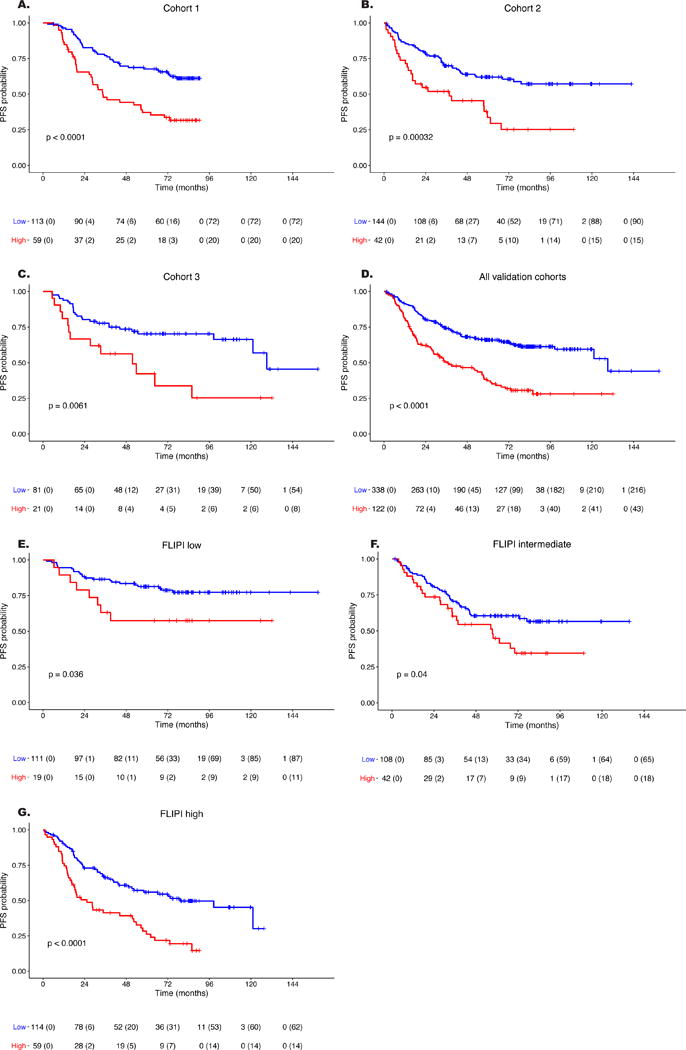
Figure 4. Kaplan-Meier estimates of progression-free survival predicted by the 23-gene signature score among patients of the three validation cohorts and according to FLIPI score.

The threshold set in the training cohort separated patients into high- and low-risk groups (red and blue curves, respectively). The 23-gene score significantly predicted PFS in patients from each validation cohort (A-C: Cohort 1, 2, and 3, respectively) as well as in the combined validation cohorts (D) and in each FLIPI subgroup (E-G: low, intermediate and high risk FLIPI scores, respectively). Logrank test p-values for each of the comparisons are reported. FLIPI score was available for 453 patients. Abbreviations: PFS: progression-free survival; 95%CI: 95% confidence interval.
