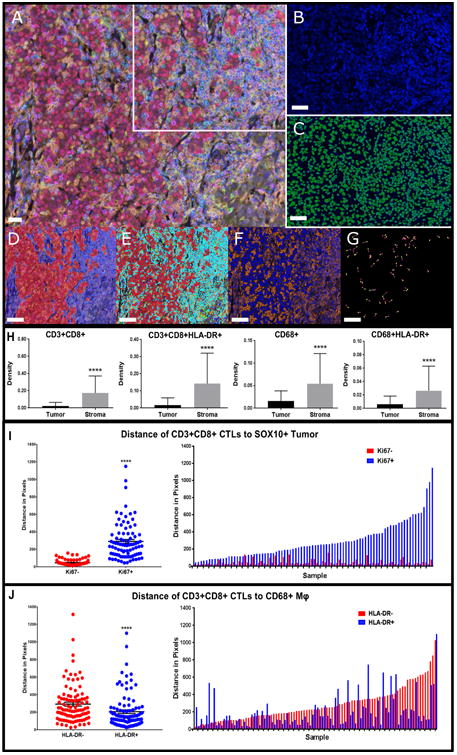
Figure 1. Characterization of the tumor immune microenvironment with qmIF, including evaluation of spatial distribution of CTLs relative to tumor cells and CD68+ macrophages.

Processing of slides done in inform™ (Perkin Elmer). Steps for analysis using inForm represented using a single image from one patient. A) Multiplex image of a melanoma stained using qmIF. DAPI (nuclei, blue), SOX10 (tumor, red), CD3 (T cells, cyan), CD8 (CTLs, magenta), CD68 (macrophages, green), Ki67 (proliferation marker, yellow), HLA-DR (activation marker, orange). B) Area from the multiplex image (marked by white inset) zoomed in as DAPI only. C) Cell segmentation of zoomed DAPI image. (D-G) are representative analysis steps of the image in (A). D) Tissue segmentation. E) Phenotyping showing base phenotypes:macrophages (green), T cells (cyan), Tumor (red) and Other (blue). F) Scoring with representation of HLA-DR scoring (orange). G) Representative visual example of Nearest Neighbor Analysis to evaluate distance between CD3+CD8+ (pink) and SOX10+Ki67+ (yellow). H) Density of CTLs and CD68+macrophages (n=104). CD3+CD8+ (far left, p<0.0001); CD3+CD8+HLA-DR+ (middle left, p<0.0001); CD68+ (middle right, p<0.0001); CD68+HLA-DR+ (far right, p<0.0001). I) Median distance of CTLs to SOX10+Ki67– (red) or SOX10+Ki67+ (blue) grouped (left, p<0.0001) (n=86). Matched median distance to Ki67− and Ki67+ per patient (right). J) Median distance of CD3+CD8+ to CD68+HLA-DR– (red) or CD68+HLA-DR+ (blue) grouped (left, p<0.0001) (n=97). Matched median distance to HLA-DR− and HLA-DR+ per patient (right). Macrophages: Mφ. Statistical comparison performed using Mann Whitney test. *P≤0.05, **P≤0.01 ***P≤0.001, ****P≤0.0001. A-G images: white bars = 10μm.
