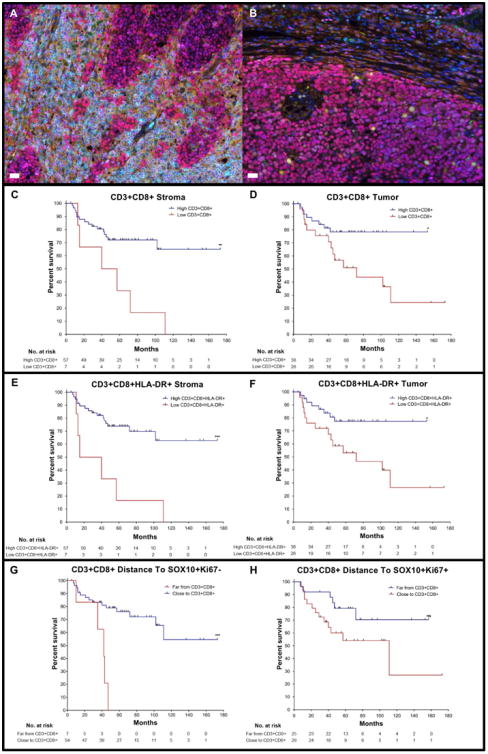
Figure 2. Infiltration of CTLs in tumor and stroma and distance of CTLs to non-proliferating tumor cells associates with DSS.

Melanoma slides were stained for qmIF with DAPI (blue), SOX10 (red), CD3 (cyan), CD8 (magenta), CD68 (green), Ki67 (yellow), and HLA-DR (orange). Multiplex images of melanoma showing A) high and B) low infiltration of CTLs in tumor. Kaplan Meier (KM) curves were created using classification and regression tree (CART) analysis for each variable shown in Figures C-H. C) High (n=57) and low (n=7) density of CD3+CD8+ cells in the stroma (p=0.0038). D) High (n=38) and low (n=26)CD3+CD8+ cells in the tumor (p=0.0147). E) High (n=57) and low (n=7) density of CD3+CD8+ HLA-DR+ cells in the stroma (p=0.0005). F) High (n=38) and low (n=26) density ofCD3+CD8+HLA-DR+ cells in the tumor (p=0.0167). G) Far (n=7) and Close (n=54) sistance of CD3+CD8+ cells to SOX10+Ki67− tumor cells (p=0.0006). H) Far (n=25) and Close (n=29) distance from CD3+CD8+ cells to proliferating (SOX10+Ki67+) tumor cells (p=0.0618).Statistical comparison performed using Log-rank (Mantel-Cox) test. ns: not significant (P>0.05), *P≤0.05, **P≤0.01 ***P≤0.001, ****P≤0.0001. White bars in A and B = 10μm.
