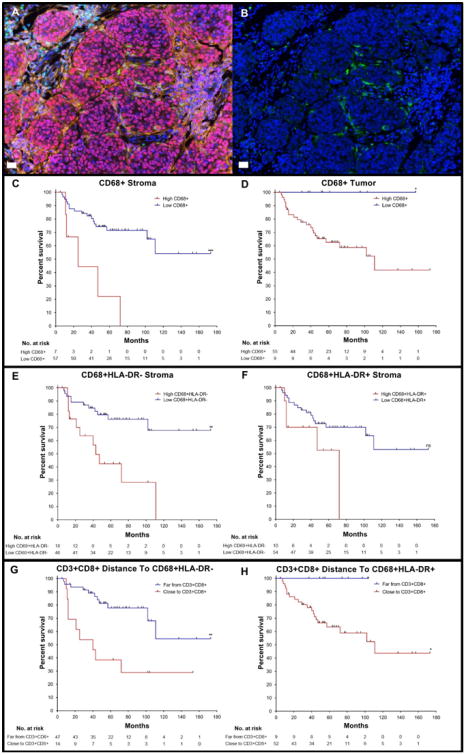
Figure 3. High infiltration of CD68+macrophages in the tumor and stroma and close distance of CTLs to HLA-DR− macrophages associates with poor DSS.

A) Multiplex image of a melanoma slide stained using qmIF for DAPI (blue), SOX10 (red), CD3 (cyan), CD8 (magenta), CD68 (green), Ki67 (yellow), and HLA-DR (orange). B) Multiplex image of melanoma showing DAPI (blue) and CD68 (green) for macrophages. KM curves were created using CART analysis for each variable shown in Figures C-H. C) High (n=7) and low(n=57) density of CD68+ macrophages in the stroma (p=0.0006). D) High (n=55) and low (n=9) density of CD68+macrophages in the tumor (p=0.0426). E) High (n=18) and low (n=46) density of CD68+HLA-DR− macrophages in the stroma (p=0.0013). F) High (n=10) and low (n=54) density of CD68+HLA-DR+ macrophages in stroma (p=0.0637). G) Far (n=47) and Close (n=14) distance of CTLs to HLA-DR− macrophages (p=0.0016). H) Far (n=9) and Close (n=52) distance of CTLs to HLA-DR+macrophages (p=0.0388). Statistical comparison performed using Log-rank (Mantel-Cox) test. ns: not significant (P>0.05), *P≤0.05, **P≤0.01 ***P≤0.001, ****P≤0.0001). White bars in A and B = 10μm.
