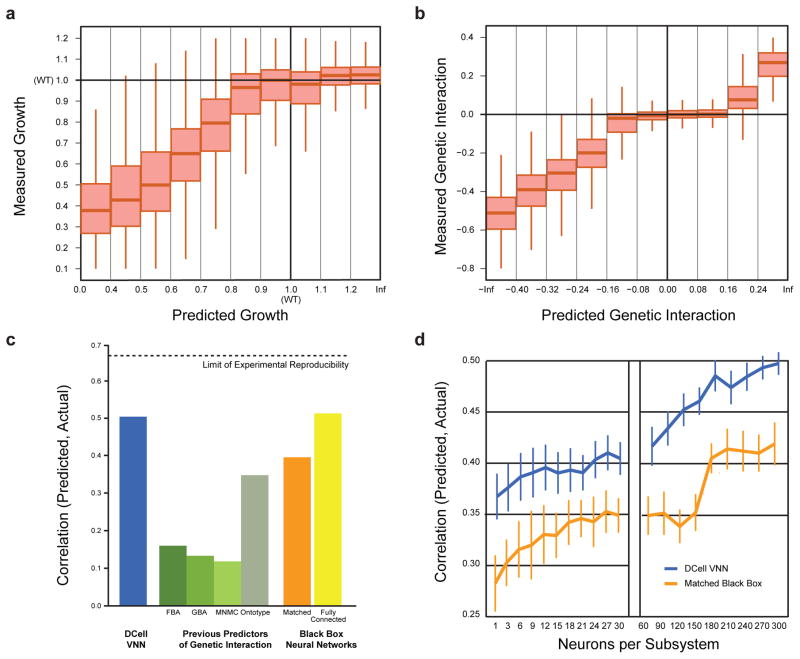
Figure 2. Prediction of cell viability and genetic interaction phenotypes.
a, Measured versus predicted cell viability relative to wild type (WT = 1) on the Costanzo et al.16 dataset. b, Measured versus predicted genetic interaction scores for each double gene disruption genotype; genetic interactions between the disrupted genes can be positive (epistasis), zero (non-interaction), or negative (synthetic sickness or lethality). c, Model performance expressed as the correlation between measured and predicted genetic interaction scores. Performance of DCell (first bar, blue) is compared to previous methods for predicting genetic interactions (second four bars, shades of green): FBA, Flux Balance Analysis17; GBA, Guilt By Association18; MNMC, Multi-Network Multi-Classifier19; Ontotype13. Performance is also shown for matched black-box structures in which gene-to-subsystem mappings are randomly permuted (orange bar, average of 10 randomizations) or for fully-connected neural networks with the same number of layers as DCell (final bar, yellow). Correlations were calculated across gene pairs that meet an interaction significance criterion of p<0.05. d, Predictive performance versus number of neurons per subsystem. Performance measure and two structural hierarchies as in (c).

