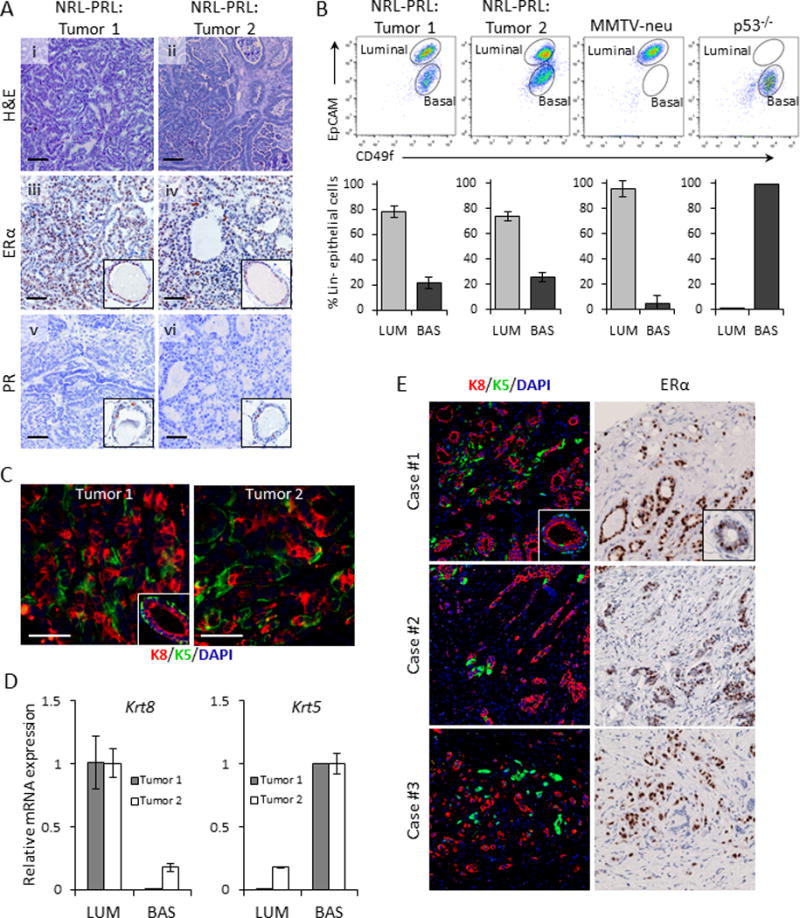
Figure 1. NRL-PRL mice develop ERα+ adenocarcinomas composed of luminal and basal epithelial subpopulations.

(A, i,ii) Adenocarcinomas of varying histotypes (“Tumor 1” (i) and “Tumor 2” (ii)) develop spontaneously in nulliparous female NRL-PRL mice (hematoxylin and eosin stain). (A, iii,iv) ERα expression in Tumor 1 (iii) and Tumor 2 (iv). (A, v,vi) Undetectable progesterone receptor (PR) expression in both Tumor 1 (v) and Tumor 2 (vi). Insets, ERα and PR staining in luminal epithelium; cross sections of mammary ducts. Scale bars, 50 μm. (B) Representative flow cytometric plots showing differences in tumor subpopulations among NRL-PRL, MMTV-neu, and p53−/− tumors. Bar graphs represent percentages of luminal (EPCAMhiCD49f+) and basal (EPCAMmedCD49f+) cells relative to total Lin-tumor cells (N=3; mean±S.D.). (C) Immunofluorescent staining of Tumors 1 and 2 using lineage-specific markers, cytokeratin-8 (K8) (red) and cytokeratin-5 (K5) (green). Inset shows a cross section from a normal mammary duct. Scale bars, 50 μm. (D) Relative Krt8 and Krt5 mRNA levels in FACS sorted luminal and basal subpopulations from the two tumors. (E) ERα+ patient tumor cores from a clinical breast tumor microarray showing pseudocolored K8 (red) and K5 (green) immunostaining (left panel) and ERα immunostaining with hematoxylin counterstain of a nearby section from the same core (right panel). Insets show staining of a normal mammary duct.
