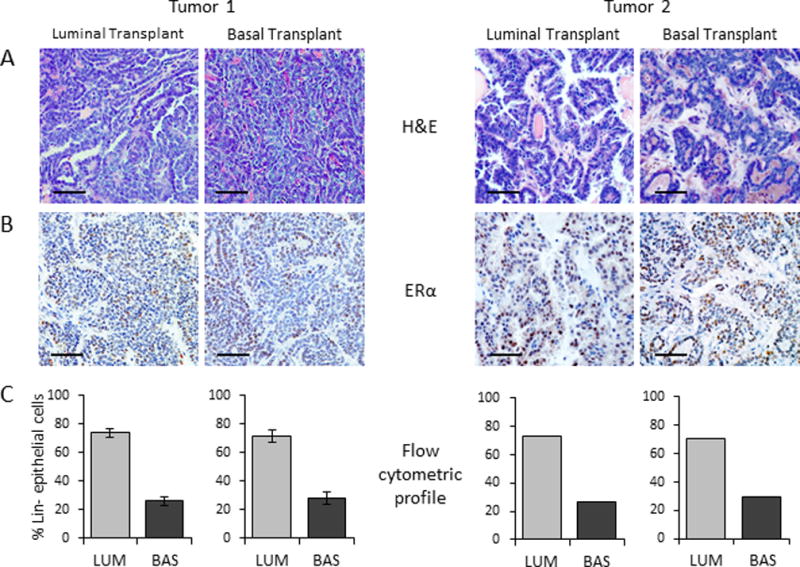
Figure 2. Transplantation of limiting numbers of cells from the luminal and basal tumor subpopulations regenerates carcinomas with characteristics of the parental tumor.

Representative photomicrographs of secondary tumors derived from sorted luminal and basal subpopulations demonstrating similar morphology, ERα expression and heterogeneity of the parent tumor. (A)H&E, (B) ERα IHC, and (C) flow cytometric analysis (Tumor 1: N=3, mean±S.D.; Tumor 2: N=1; others were too small for analysis). Scale bars, 50 μm.
