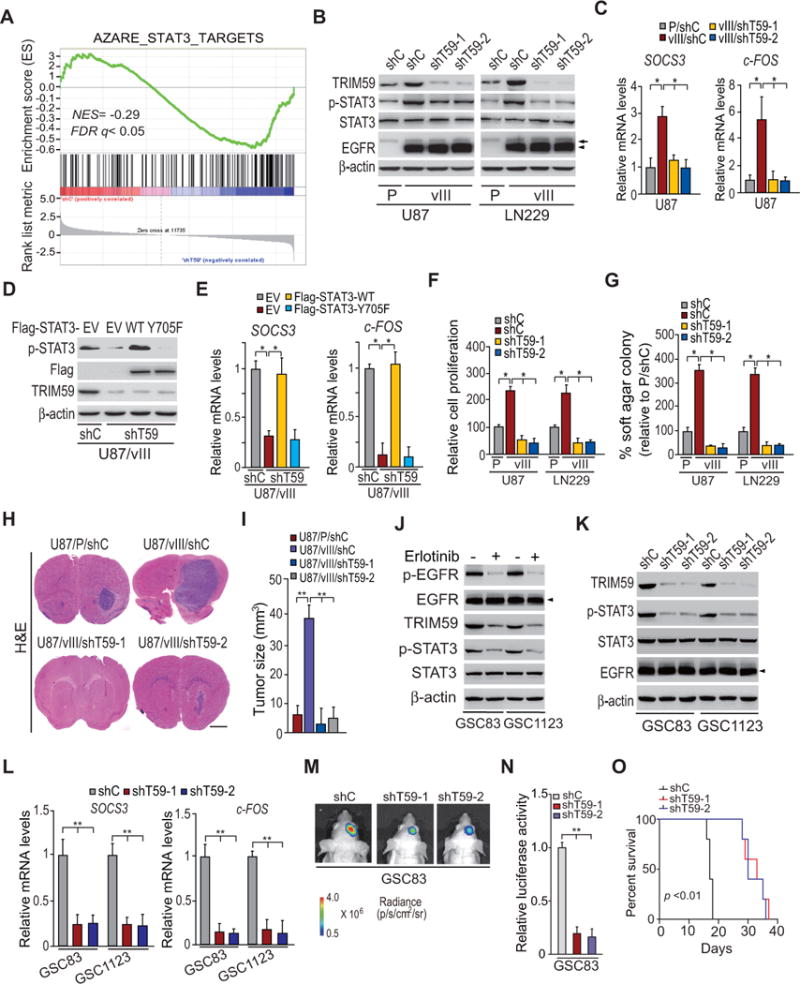
Figure 3. Knockdown of TRIM59 inhibits EGFRvIII-stimulated STAT3 activity.

A, Gene set enrichment analysis (GSEA) of STAT3 target genes using ranked gene expression changes in TRIM59-knockdown LN229/EGFRvIII cells compare to control cells. NES, normalized enrichment score. B, WB assays of the effects of TRIM59 knockdown with two different shRNAs (shT59-1 and shT59-2) compared to a control shRNA in LN229 and U87 GBM cells on EGFRvIII-stimulated STAT3 phosphorylation. Arrows, EGFR. Arrow heads, EGFRvIII. C, qRT-PCR analyses of effects of TRIM59 depletion on SOCS3 and c-FOS expression in B. D, WB assays of overexpression of Flag-tagged STAT3 wild type (WT) or an inactive form of STAT3 (Y705F) mutant or an empty vector (EV) in U87/EGFRvIII GBM cells with or without TRIM59 knockdown. E, qRT-PCR analyses of the effects of overexpression of Flag-STAT3 WT or Y705F mutant on TRIM59 depletion-inhibited expression of SOCS3 and c-FOS in D. F and G, Effects of knockdown of TRIM59 on in vitro cell proliferation (F) and cell colony formation (G). H, shRNA knockdown of TRIM59 inhibits EGFRvIII-promoted U87 tumor growth in the brain. I, Quantification of tumor size in H. J, Effects of EGFRvIII on expression of TRIM59 and p-STAT3. GSC83 and GSC11233 GSCs were treated with Erlotinib (10 μM) for 24 h. β-Actin was used as a control. Arrow heads, EGFRvIII. K and L, Knockdown of TRIM59 inhibits p-STAT3 and EGFRvIII-induced transcription of SOCS3 and c-FOS in GSC83 and GSC11233 GSCs. M, Representative bioluminescence images of brains with indicated GSC83 control or TRIM59 knockdown GSCs at 13 days after implantation. Images represent results of five mice per group of two independent experiments. N, Quantification of the bioluminescence activity in M. O, Kaplan–Meier analysis of animals with shT59-expressing GSC83 GSC tumors versus shC-expressing tumors. Statistical analysis was performed by log-rank test. Median survival (in days): shC, 17; shT59-1, 33; shT59-2, 30. Error bars ± SD. *P < 0.05. Data are representative of two or three independent experiments with similar results.
