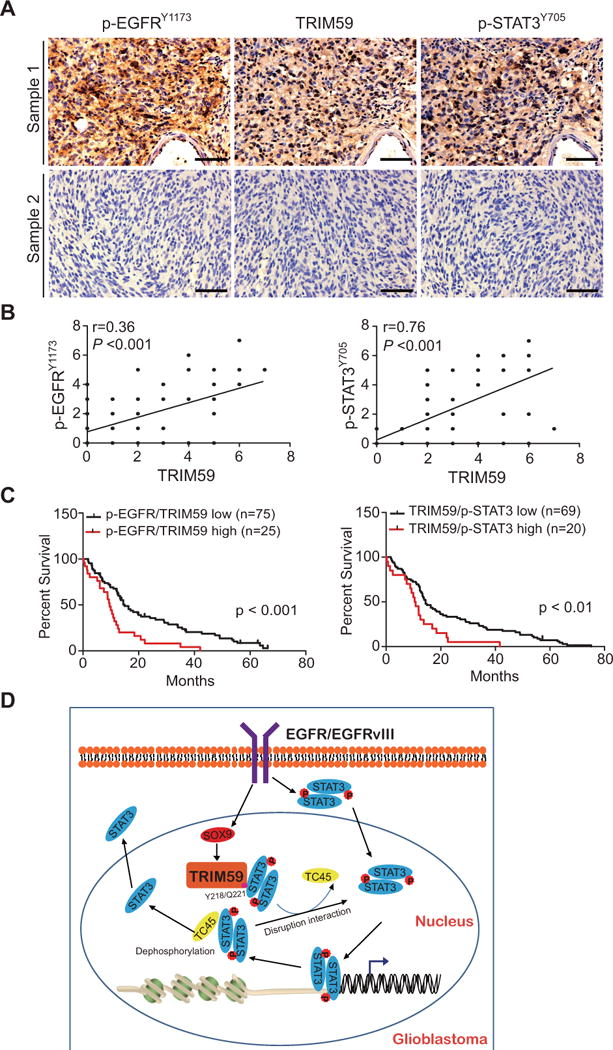
Figure 7. Co-expression of p-EGFRY1173, TRIM59, and p-STAT3Y705 is correlated with a worse prognosis of gliomas.

A, In total, 107 GBM specimens were analyzed by IHC. Representative images of two GBM specimens that were IHC stained positive or negative by the indicated antibodies. Scale bars: 50 μm. B, Correlation of expression between p-EGFRY1173 and TRIM59, or TRIM59 and p-STAT3Y705. C, Kaplan-Meier analyses of patients with high p-EGFRY1173/high TRIM59-expressing tumors (red line) versus low EGFRY1173/low TRIM59-expressing tumors (black line), or high TRIM59/high p-STAT3Y705-expressing tumors (red line) versus low TRIM59/low p-STAT3Y705-expressing tumors (black line) based on IHC analyses in A. Median survival (in months) in left: low, 14.90; high, 9.53. Median survival (in months) in right: low, 14.51; high, 10.13. P values were calculated by the log-rank test. Black tick markers indicate censored data. D, A working model of EGFR/TRIM59/STAT3 signaling pathway in glioma tumorigenesis.
