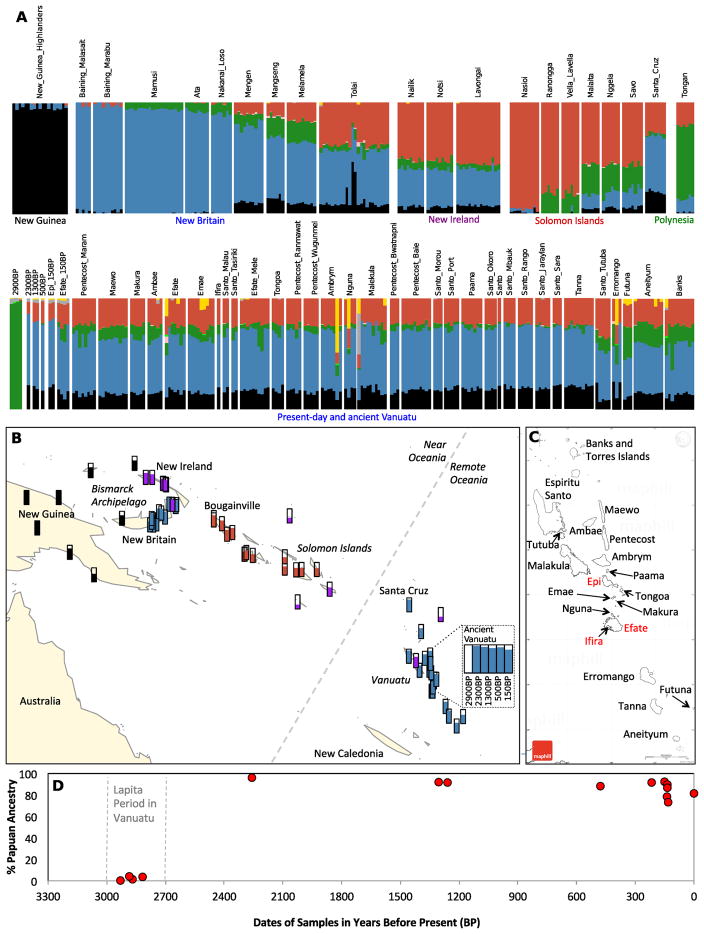
Figure 1. Locations and broad-scale genetic structure of analyzed populations.
(A) ADMIXTURE results with K=8 clusters for selected populations (full results in Figure S1). The analysis suggests three primary Papuan components (black maximized in New Guinea, blue in New Britain in the Bismarck Islands, and red maximized in the Solomon Islands) and a component maximized in First Remote Oceanians (green). (B) Population locations with colored clusters assigned based on the ratio of Papuan ancestry components in ADMIXTURE. We loosely adopt the color scheme from ADMIXTURE, with black indicating a New Guinea-like profile, blue a New Britain-like profile, red a Solomon Islands-like profile, and purple a profile mixed between New Britain and Solomon Islands. Level of fill in the bars indicates Papuan ancestry proportion. The map was plotted in R using the ‘maps’ package with data from http://www.naturalearthdata.com/. (C) Close-up of Vanuatu labeling islands for which new data are reported. Islands with ancient samples are indicated in red (for Efate and Ifira, both present-day and ancient individuals). The map was downloaded from http://www.maphill.com/vanuatu/simple-maps/blank-map/no-labels/. (D) Papuan ancestry proportions for ancient samples over time; Efate island is used to represent the present. See also Figure S2 and Data S1.

