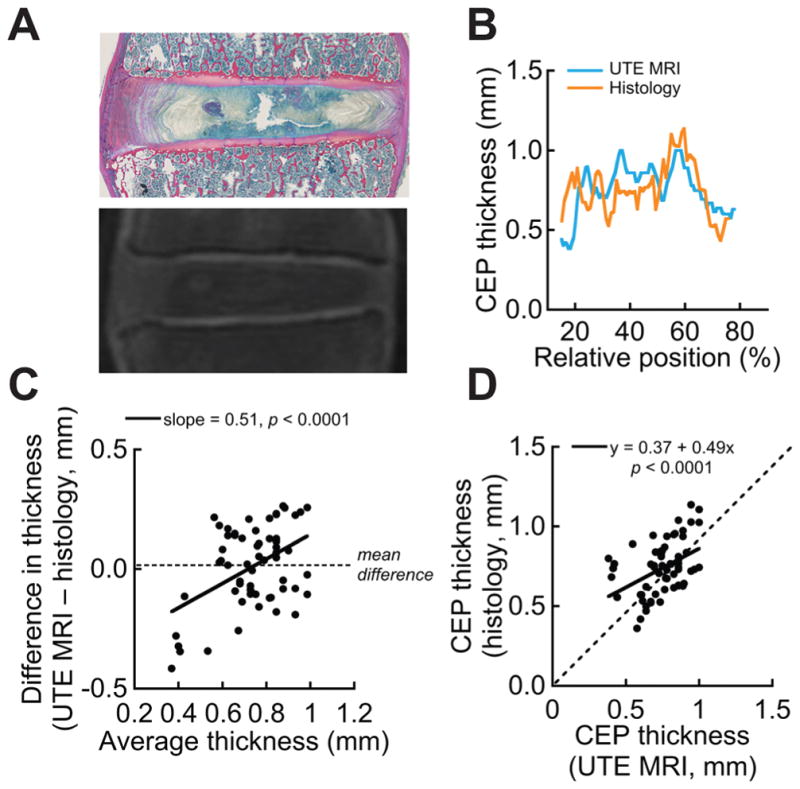
Figure 4.

(A) Site-matched histology and UTE MR images; (B) Comparison of CEP thickness between UTE MRI and histology for a selected CEP section; (C) Bland-Altman plot for the same section, where proportional bias (slope) is 0.51 and mean difference is 0.013 mm; (D) Correlation between UTE and histology for the same section (slope = 0.37, which is less than 1, indicating that UTE overestimated the variation in endplate thickness). Dashed line denotes identical thickness measurement between UTE and histology.
