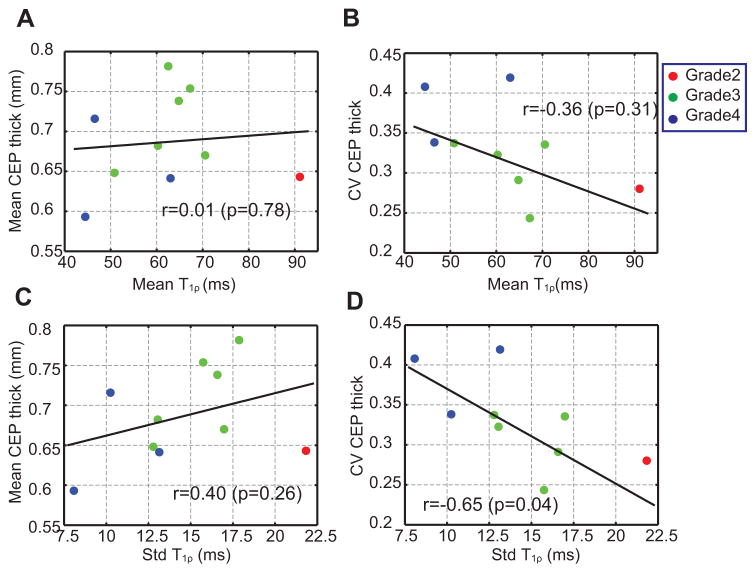
Figure 7.
(A–D) Linear regression of the mean and CV of CEP thickness versus the mean and standard deviation of T1ρ. The standard deviation of T1ρ and the CV CEP thickness have a significant negative correlation (D). Data points are color-coded by Pfirrmann grade. Pearson correlation coefficients and p-values are also denoted.

