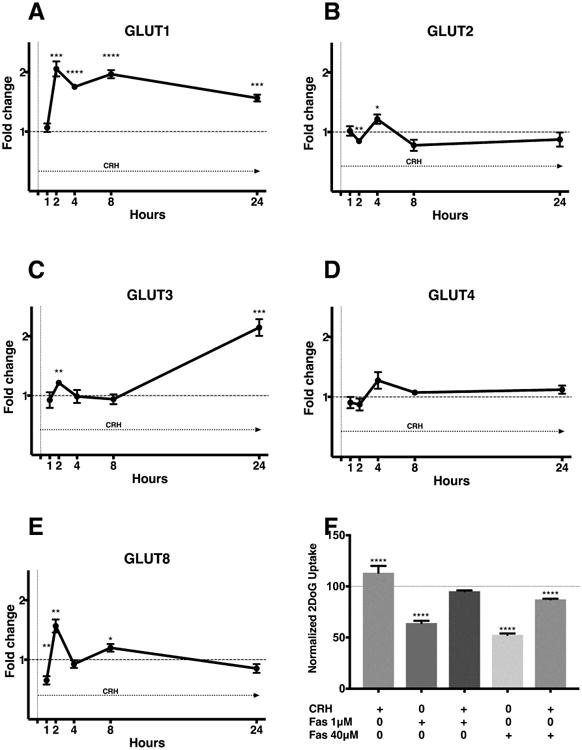
Figure 3. CRH stimulation results in transcriptional upregulation of GLUT1.

Expression of glucose transporters was calculated by ΔΔCt method following RT-qPCR. GLUT1 is overexpressed throughout the period of continuous exposure to CRH in AtT20 D16:16 cells starting at 2 h (A). Other glucose transporters are variably expressed during CRH exposure. The response to CRH was modest at early time points for GLUT2 (B) and GLUT 3 (C) whilst GLUT3 seemed to have a delayed response at 24h (C). No significant increase was noted for GLUT4 (D). GLUT8 reflected a similar pattern of expression when compared to GLUT1 with a less robust increase (E). The duration of exposure is denoted within each panel with an arrow underneath ‘CRH’. CRH-mediated glucose uptake in AtT-20 cells was blunted by GLUT1 inhibitor Fasentin following a 3-hour exposure (F). However, CRH exposure reversed the decreased glucose uptake caused by a a lower dose of Fasentin (1μM). A higher dose of fasentin (40μM) dose prevented CRH mediated normalization of glucose uptake. This reduction below baseline likely due to the large effect of high dose Fasentin on of glucose uptake at baseline (F). The data shown is representative of experiments carried out in both biological and technical triplicates. * p ≤ 0.05, ** p ≤ 0.01, *** p ≤ 0.001, **** p ≤ 0.0001 compared with corresponding control values. Horizontal bars represent mean ± standard errors of mean (SEM). Abbreviations: CRH - corticotropin-releasing hormone, GLUT – glucose transporter, PCR -polymerase chain reaction
