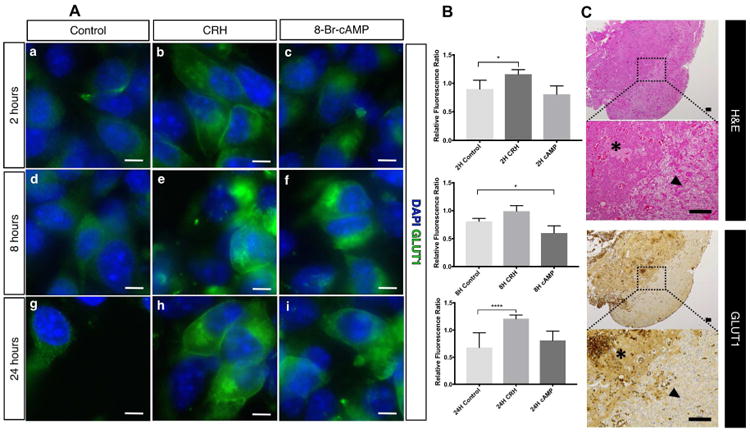
Figure 4. GLUT1 is overexpressed in pituitary adenomas and its translocation increases with CRH administration.

Fluorescence immunocytochemistry revealed increase in total GLUT1 content within AtT20/D16:16 cells with CRH and 8-Br-cAMP stimulation (A: b to i). This effect was seen as early as 2 h (A: b and c). Continuous CRH stimulation resulted in a robust and sustained GLUT1 membrane translocation (A: e and h). Representative immunofluorescence images are shown. GLUT1 membrane tranlocation was quantified as relative fluorescence ratio between averaged plasma membrane region versus cytosolic region using eight representative cells for each condition (B). The middle bars demonstrate a significant increase in GLUT1 localization to plama membrane region with 2-hour (p < 0.05) and 24-hour (p < 0.0001) exposure to CRH. Pituitary adenomas (asterix) harvested from patients who underwent transsphenoidal adenomectomy had higher GLUT1 expression than the surrounding pituitary gland (black arrowhead) (C). Adjacent histopathological sections of surgical specimens were examined with hematoxylin and eosin staining (top) and with GLUT1 immunohistochemical staining (bottom). Corticotropinoma demonstrated increased GLUT1 expression not associated with normal anterior pituitary gland (bottom, black arrowhead). Scale bars for fluorescence immunocytochemistry = 10 μm. Scale bars for immunohistochemistry = 100 μm. Abbreviations: DAPI – 4′,6-diamidino-2-phenylindole, GLUT1 – glucose transporter 1.
