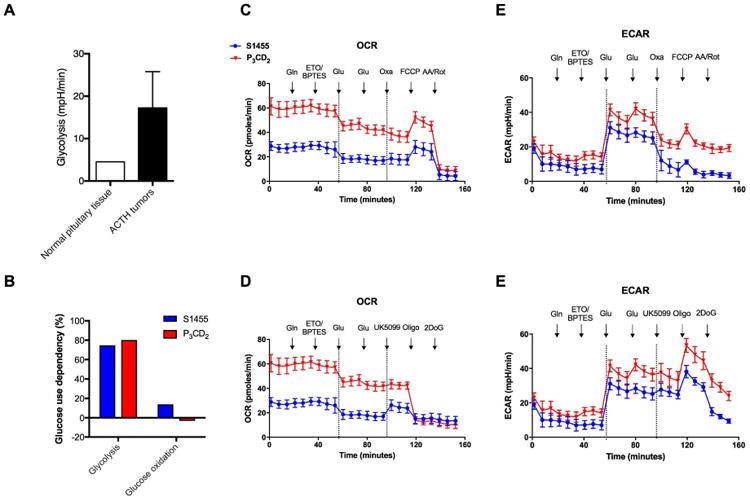
Figure 5. Pituitary adenoma cells demonstrated high glycolytic activity and low glucose oxidation.

Pituitary adenoma cells had higher glycolytic activity than normal pituitary cells (A). Human primary pituitary adenomatous cells (Tumor 1 and 2) utilized the majority of their glycolytic capacity but barely used glucose for oxidation (B). OCR and ECAR were detected using Seahorse in human primary cells Tumor 1 and Tumor 2. The first stages of C and D and the first stages of E and F were generated using the same data. X-axis was extended to mimic continuous treatments. Data between two dash lines in each part were average of the first and third stages. Note that UK5099 caused minimal changes of OCR while oxamate led to significant alterations of ECAR in both samples. Abbreviations: ECAR – extracellular acidification rate, OCR – oxygen consumption rate.
