
Figure 3. Normalized DNMT3B gene expression levels as a function of rs910083 genotype in cerebellum from the Genotype-Tissue Expression (GTEx) project.
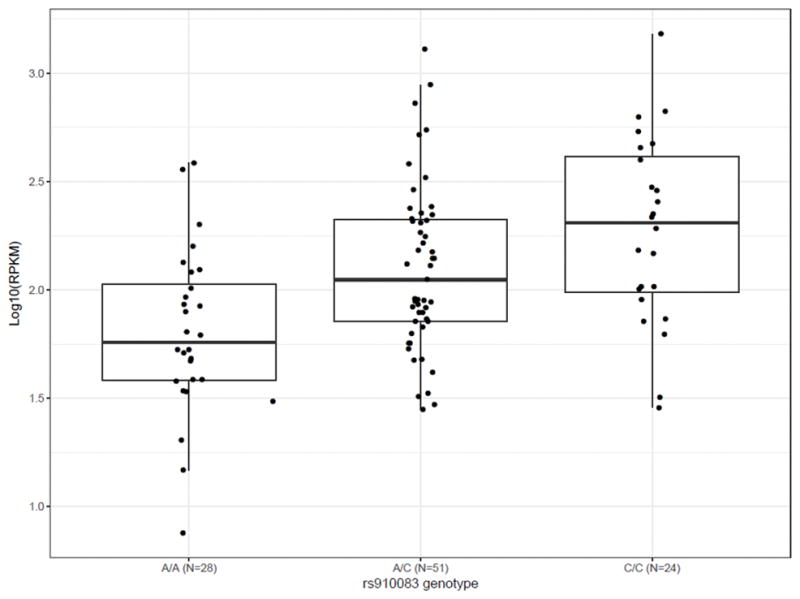
The box lines mark the first quartile, median, and third quartile; and the whiskers are marked by the highest and lowest data points within the 1.5 × inter-quartile range (third – first quartile) to show outliers that fall outside of these boundaries.