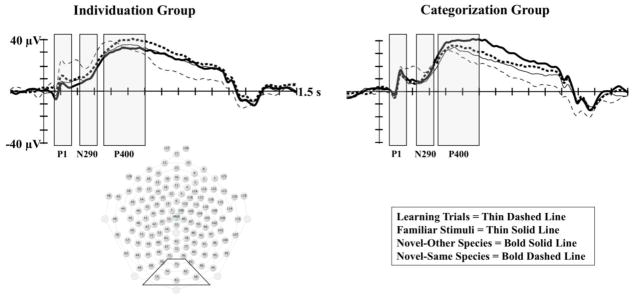
Figure 2.
The P1, N290, and P400 Components by Familiarization Group and Stimulus Type. The P1, N290, and P400 components are presented by familiarization group and stimulus type. The left panel shows ERP waveforms for the individuation group at Oz (75), and the right panel shows ERP waveforms for the categorization group at Oz. The midline occipital electrode cluster used in the analyses is indicated in the sensor net layout shown to the bottom left. The open rectangles indicate the time window of the analyses for each component.

