
Figure 3.
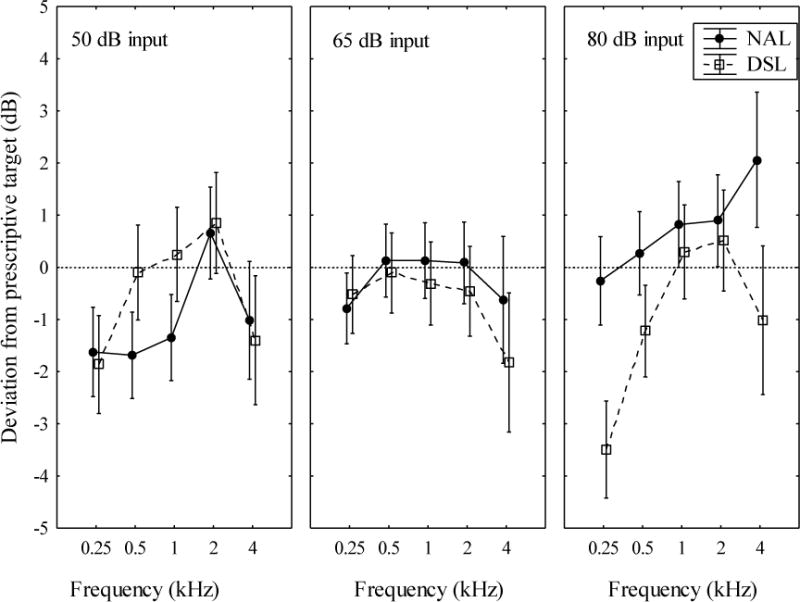
Mean deviations (dB) of measured couple gains from prescriptive targets as a function of frequency at low (50 dB SPL), medium (65 dB SPL), and high (80 dB SPL) input levels. The filled circles depict mean values for the NAL prescription group in the randomised trial, and the open squares depict mean values for the DSL prescription group. Vertical bars indicate 95% confidence intervals.