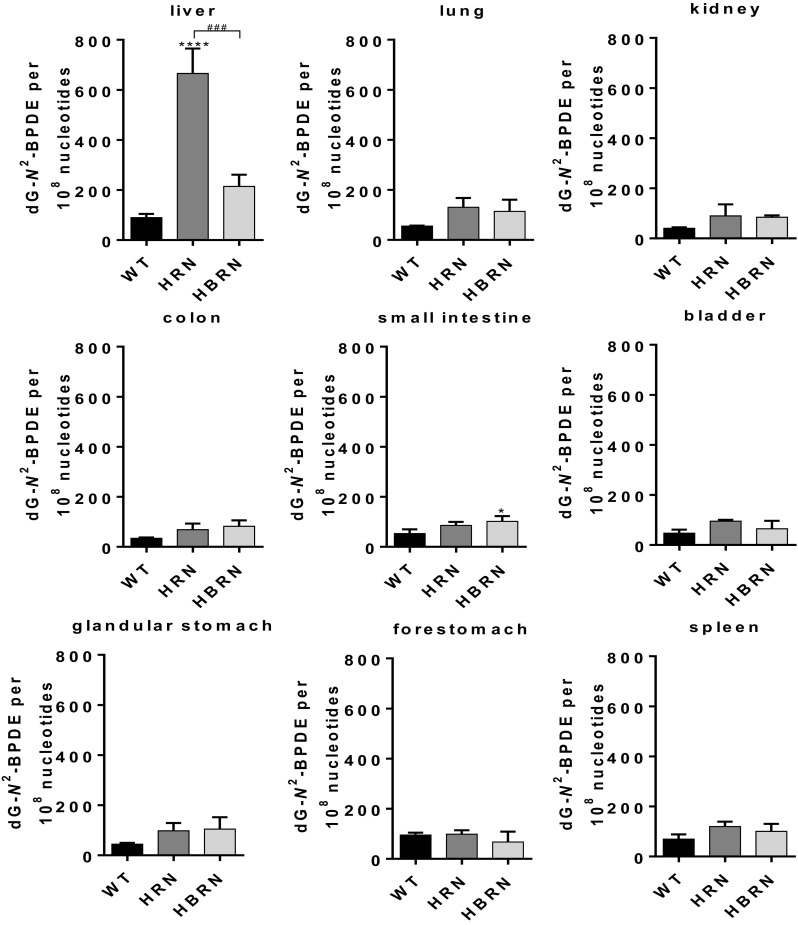
Fig. 6.

Quantitative TLC 32P-postlabelling analysis of dG-N2-BPDE adducts in individual organs of WT, HRN and HBRN mice treated i.p. with 125 mg/kg bw BaP for 24 h. Values are given as mean ± SD (n = 3). Statistical analysis was performed by one-way ANOVA with Tukey’s multiple comparison test (*, compared to WT; #, compared to HRN. *P ≤ 0.05, ***P ≤ 0.001, ****P ≤ 0.0001)
