
Fig. 3.
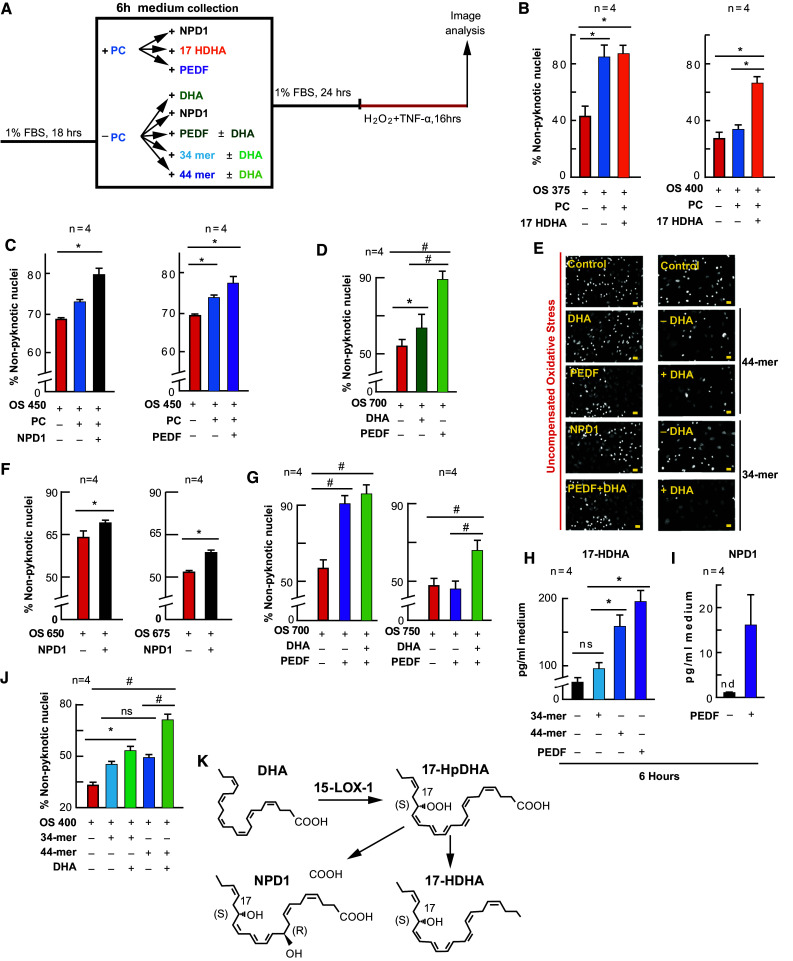
NPD1 and PEDF enhance and mimic PC. APRE-19 cells were treated with NPD1, 17-HDHA, PEDF, or vehicle ± mild oxidative preconditioning prior to lethal OS. Cell nuclei were imaged for cell survival using MAIM, and media was collected for lipid analysis after 6 h PEDF or PEDF fragment supplementation. a Experimental design. b, c, d, f, g, j Quantification of non-nuclear pyknosis (protection) ±50 µM H2O2, DHA (200 nM), NPD1 (100 nM), 17-HDHA (100 nM), PEDF (1 nM), or PEDF protein fragments 34- or 44-mer. e Example 10×, zoomed-in grey-scale micrographs of nuclei treated with 17-HDHA, NPD1, PEDF, 34-mer, or 44-mer ± 200 nM DHA, and stained with Hoestch 33258. k Schematic depicting DHA conversion to 17-HDHA and NPD1 via 15-LOX-1. h, i UPLC-ESI-MS/MS quantification of 17-HDHA and NPD1 following 6 h supplementation of PEDF, 34-mer, or 44 mer. Lipid concentrations were normalized using deuterium-labeled internal standards and to medium volume. * p < 0.05, # p < 0.001), scale bar 10 µM