
Fig. 4.
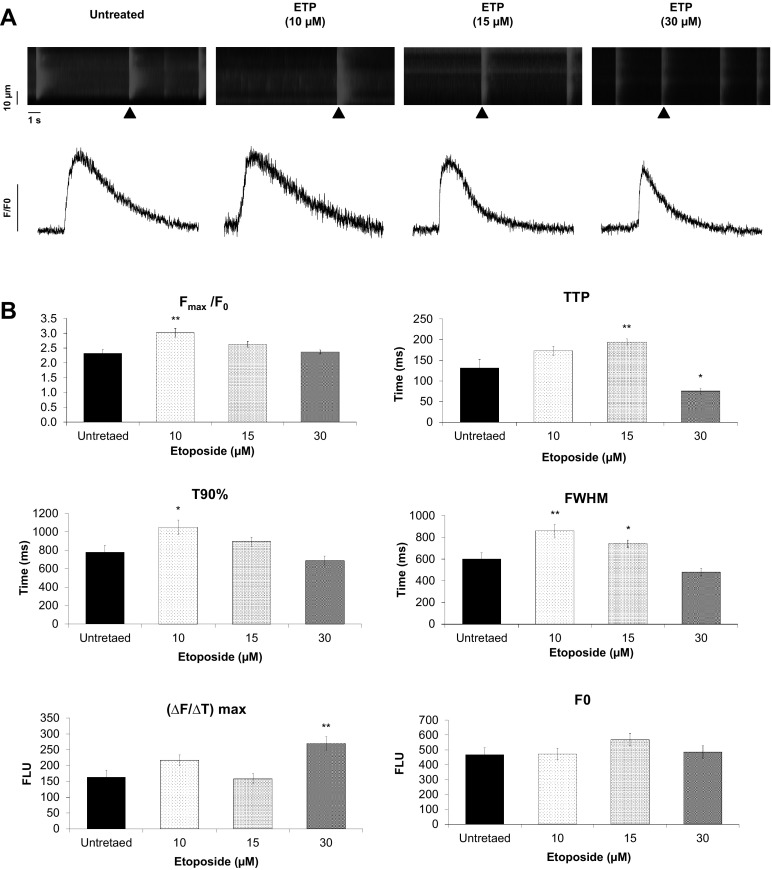
Etoposide causes alterations in calcium handling in hiPSC-CMs. a Confocal line-scan images showing changes in intracellular [Ca2+]i in a Rhod-2, AM loaded hiPSC-CM. The images show alterations in spontaneous whole-cell Ca2+ transients in response to ETP treatment (upper panel). Scale bar represents, time − 1 s and distance − 10 µm. Representative tracings of spontaneous Ca2+ transients (black arrow head) in hiPSC-CMs from untreated and ETP-treated groups (lower panel). b Graphs representing Ca2+ transient parameters measured from hiPSC-CMs treated with ETP. F/F0, Ca2+ transient amplitude where F0 is the averaged background-corrected resting fluorescence intensity; TTP, time-to-peak; T90%, 90% recovery of Fmax; [ΔF/ΔT]max, the maximum steepness; FWHM, full-width at half-maximum. (n = 25, error bars represent ± SEM) (t test, *p ≤ 0.05, **p ≤ 0.01)