Figure 2.
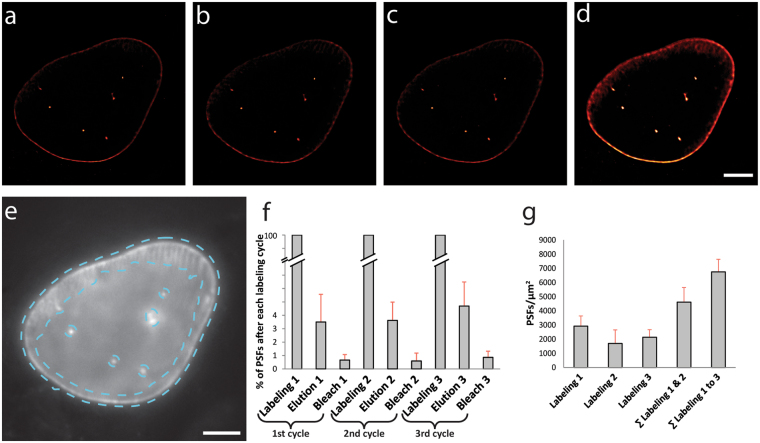
Contrast-enhanced super-resolution imaging of His10-mEGFP-LaminA with SERI. (a–c) Representative super-resolution images obtained in repetitive rounds of dSTORM imaging of His10-mEGFP-LaminA expressing U2OS cells. (d) Sum image generated from the three labeling and imaging rounds. (e) Widefield image showing the mask (cyan-colored dashed line) used for quantification of single-molecule detection events. The mask was created by smoothing and thresholding the overlaid dSTORM images. (f) Quantification of elution and bleaching. The relative number of single-molecule localizations (as point-spread functions, PSF) on the laminA structure was quantified. All PSFs of each elution and bleaching cycles were normalized to the respective bleaching-corrected labeling round. (g) Each labeling cycle and the summations of labeling densities over three labeling rounds (bars in (f,g) represent mean ± SD, N = 6 independent cells) (scale bars: 5 µm).

