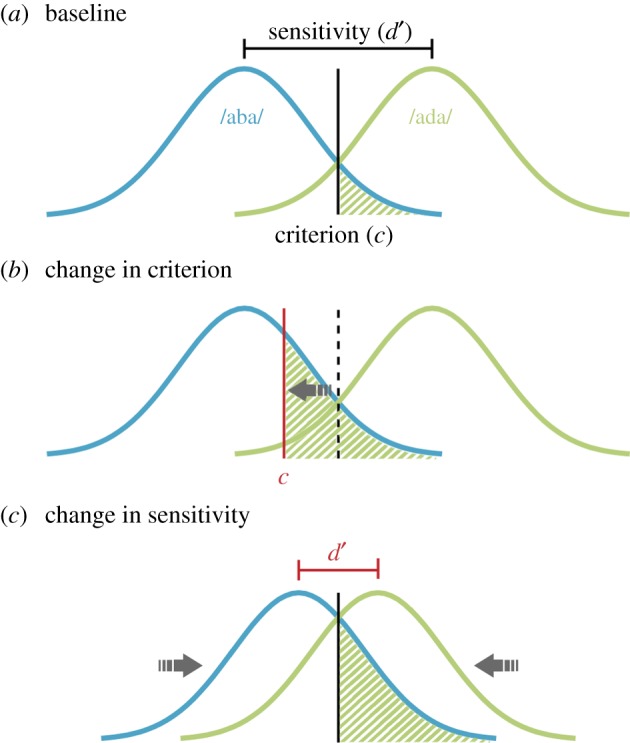
Figure 1.

Possible mechanisms underlying the recalibration effect after a McGurk illusion. (a) In a signal detection framework, two slightly overlapping curves represent the phonemes /aba/ (blue, left) and /ada/ (green, right). The distance between the two curves depicts the sensitivity d′. The criterion (vertical line) determines the perceptual label. Everything that falls to the left of the criterion is categorized as ‘aba’ and everything on the right as ‘ada’. The green shaded area depicts the false alarms; in other words, the cases when /aba/ is misperceived as ‘ada’. (b) A shift in the criterion leads to an increased percentage of misperceived /aba/, i.e. a larger shaded area compared to (a). This mechanism would be expressed in a decreased criterion after a McGurk illusion. (c) Shifting the representations closer to each other could also account for an increased percentage of misperceived /aba/. This mechanism would be expressed in a decreased sensitivity d′ after a McGurk illusion.
