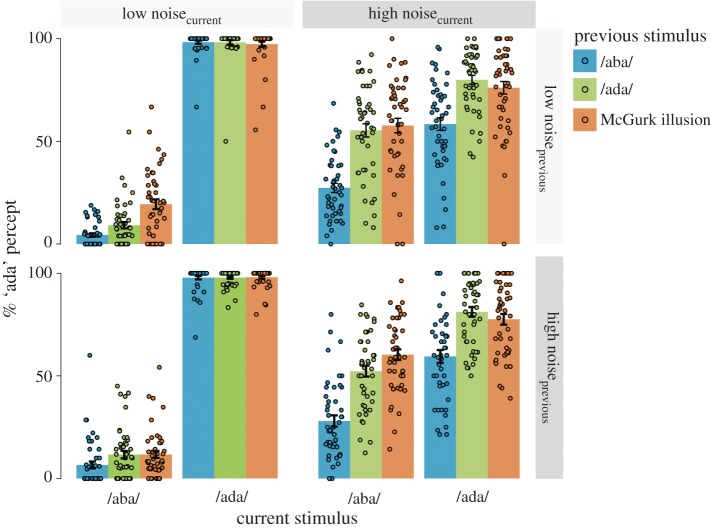
Figure 3.
Responses on all conditions. The percentage of ‘ada’ responses during auditory /aba/ and /ada/ trials are shown here (N = 47). The colours of the bars indicate the condition of the previous trial: /aba/ (blue), /ada/ (green) and McGurk illusion (auditory /aba/ and visual /aga/, orange). The dots display individual subjects. Only previous correct trials and fused McGurk trials (perceived as ‘ada’) were included. The left two quadrants depict trials without added acoustic noise and the right ones depict trials with acoustic noise. The lower two quadrants show trials that were preceded by noisy trials. The recalibration effect (more ‘ada’ percepts during /aba/ after McGurk) was strongest if the previous and current trial had the same noise level, i.e. upper left and lower right quadrants. This is reflected in a larger percentage of ‘ada’ during /aba/ after McGurk (orange bar) than after /ada/ (green bar). Error bars display the standard errors of the mean.

