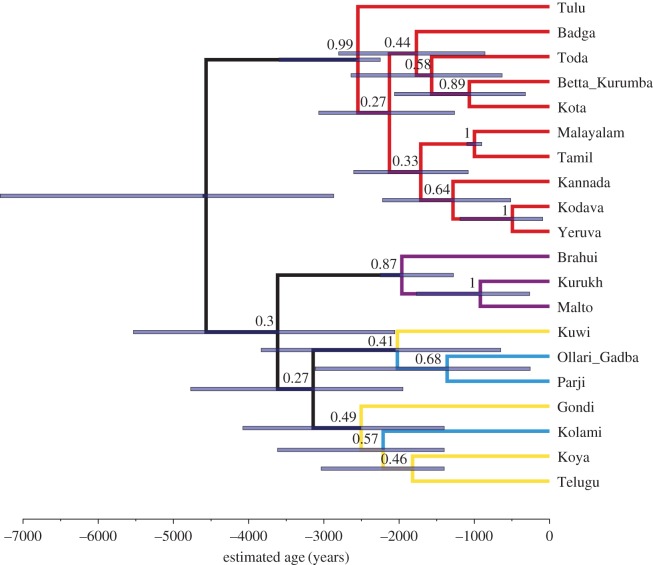
Figure 4.
Analysis without monophyletic constraints on the North, South I and South II subgroup. MCC tree summary of the posterior probability distribution of the tree sample, relaxed covarion model with relative mutation rates estimated. Node bars give the 95% highest posterior density (HPD) limits of the node heights. Numbers over branches give the posterior probability of the node to the right (range 0–1). Colour coding of the branches gives subgroup affiliation: red, South I; blue, Central; purple, North; yellow, South II.

