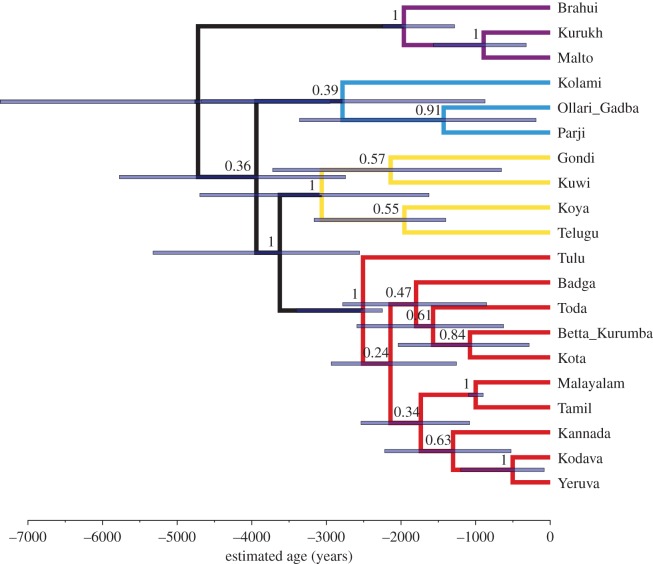
Figure 5.
Analysis with additional monophyletic constraints on South I + South II. MCC tree summary of the posterior probability distribution of the tree sample, relaxed covarion model with relative mutation rates estimated. Node bars give the 95% HPD limits of the node heights. Numbers over branches give the posterior probability of the node to the right (range 0–1). Colour coding of the branches gives subgroup affiliation: red, South I; blue, Central; purple, North; yellow, South II.

