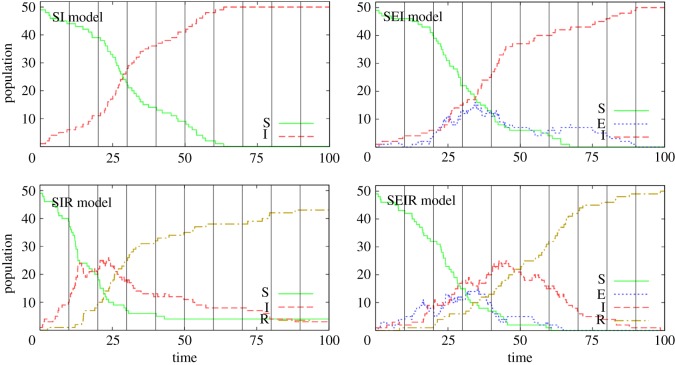
Figure 6.
Simulated results from the four models presented in figure 5 (see electronic supplementary material, appendix M for details on how these are generated). Here, we consider a population that initially has 49 susceptible individuals and a single infected. The vertical black lines indicate times at which diagnostic tests are performed. (SI: β = 0.002, SEI: β = 0.003, ν = 0.1, SIR: β = 0.004, γ = 0.05, SEIR: β = 0.004, ν = 0.1, γ = 0.05.)

