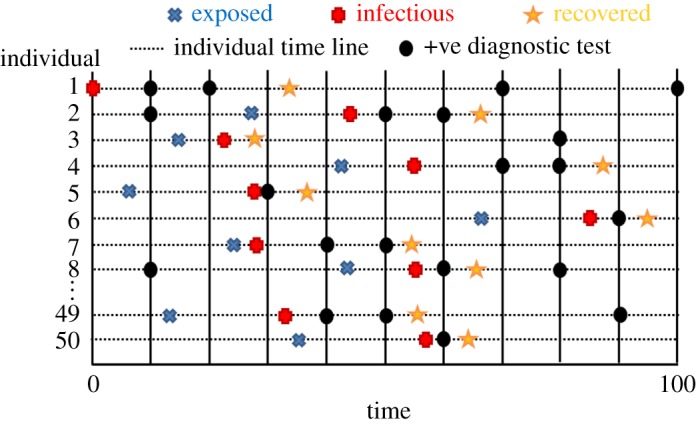
Figure 7.

Representation of an individual-based SEIR compartmental model. The horizontal dotted lines represent timelines for individuals within the population, with blue crosses, red pluses and yellow stars denoting different event types (constituting the latent variables x). The vertical black lines are testing times, with positive test results indicated by black circles (note, occasionally positive test results are generated even when an individual is uninfected because the specificity is less than 1).
