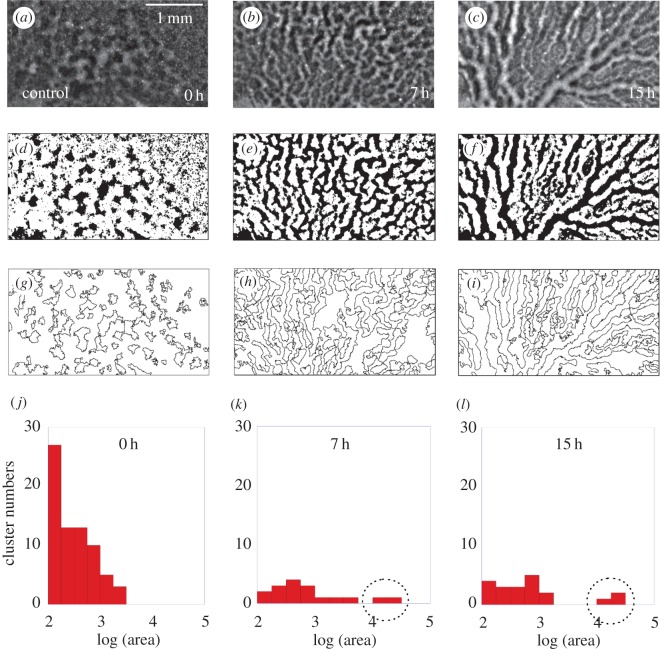
Figure 2.
Original images (a–c). Binary images (d–f), after a threshold operation show an equivalent pattern when compared with the original images. Contour lines of clusters, (g–i), identified by the plug-in Analyze Particles. From the processed images, we measure the number of endothelial cell clusters and their area. Area distribution of endothelial cell clusters (j–l) from the image sequence (d–f). (j) Displays the distribution at the initial stage. In the middle of the time-interval analysed the distribution is represented in (k), where a large cluster starts to appear as identified by the dotted circle.

