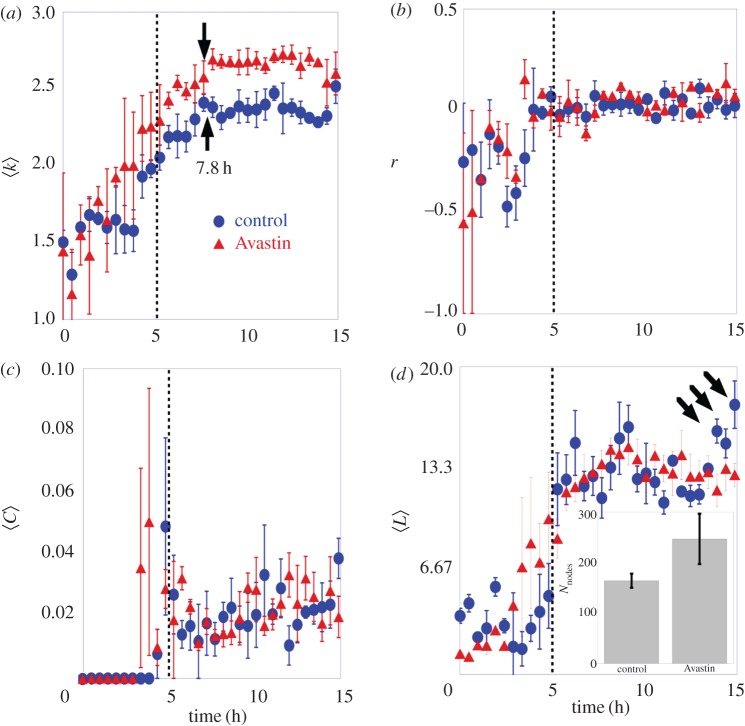
Figure 6.
Network descriptors of vascular network topologies. The filled circles represent the group of control, and the filled triangles a group of Avastin-treated embryos. (a) The mean node degree as a function of time measured on a complete vascular network. (b) The coefficient of assortativity measured on the largest cluster as a function of time. (c) The average clustering coefficient as a function of time measured on a complete vascular network. (d) The shortest path length measured on the largest cluster as a function of time. The error bar is the standard deviation for three embryos in each group. The black arrows highlight the larger value reached by the control group at the final stage. The inset graph shows the average number of nodes with the respective error bar for both groups. The vertical line is a guide to the eye for the time of 5 h.

