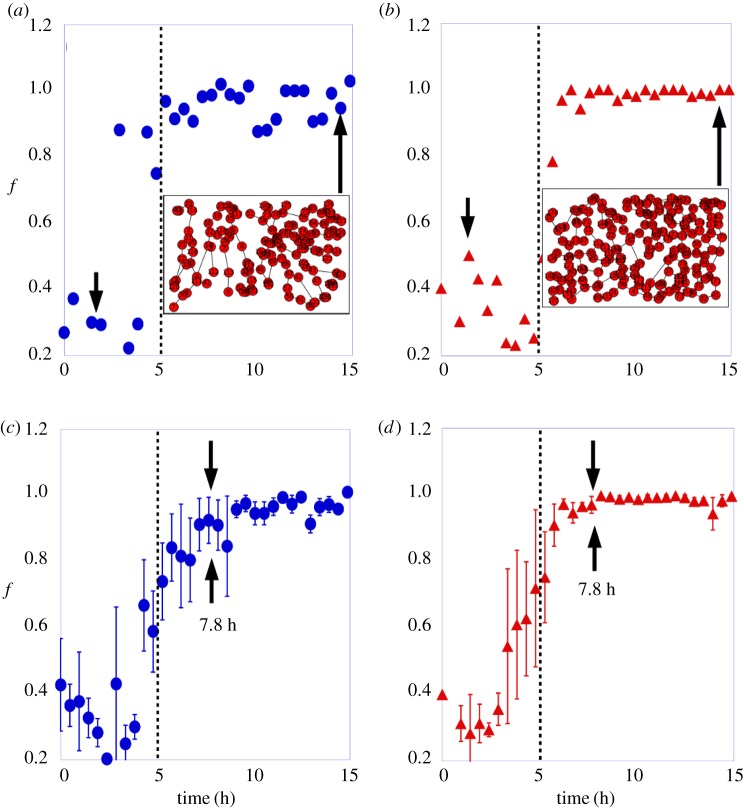
Figure 7.
The fraction of nodes in the largest cluster, f, as a function of time for (a) one control sample, and (b) for one Avastin-treated embryo. The insets display the spatial position of vascular network bifurcation. The f as a function of time in a group of three embryos for (c) control, and (d) Avastin-treated ones. The error bar is the standard deviation. The filled circles represent the data for control, the filled triangles the data for Avastin-treated embryos, and the vertical dotted line is a guide to the eye for the time of 5 h.

