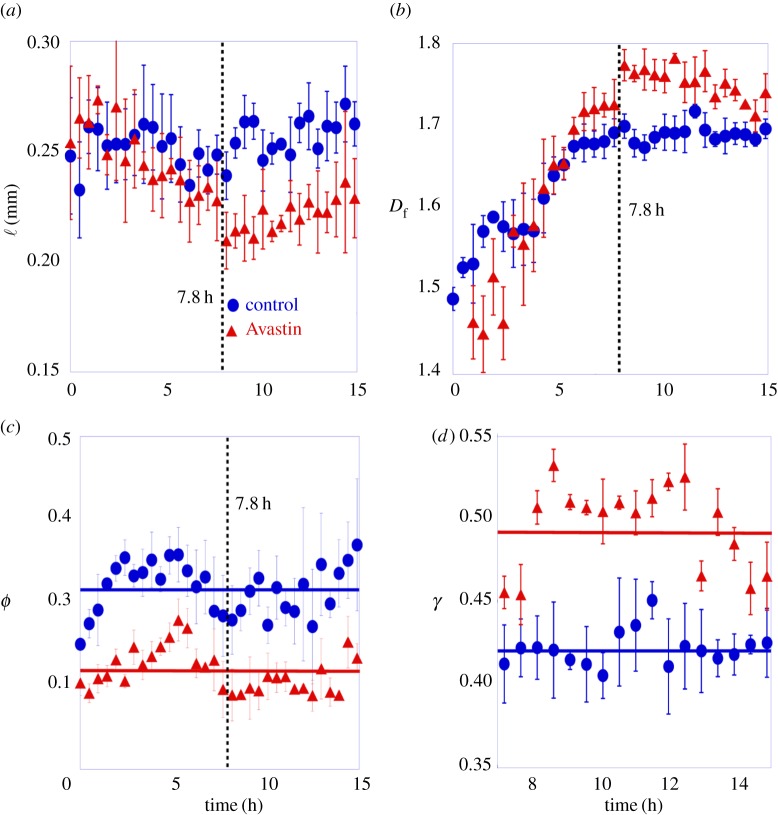
Figure 8.
Structural metrics measured on network topologies. (a) The mean cord length, ℓ, (b) the mean fractal dimension measured on a forming vascular network, Df, (c) treeness, φ and (d) the γ index measured on a formed vascular network. The error bar is the standard deviation of each group, compound by three samples. The full lines in (c) and (d) indicate the mean value of the indexes. The vertical line is a guide to the eye for the time of 7.8 h.

