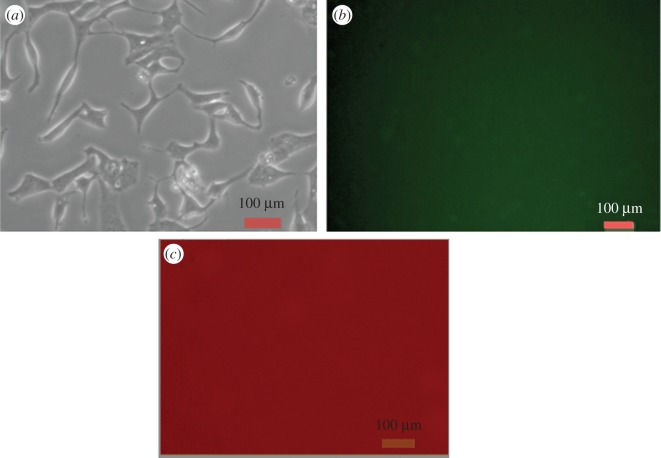
Figure 6.
Fluorescence and bright field images of live HEK 293 normal kidney cells. (a) Bright field image of HEK 293 cells directly labelled by PbS-SA-biotin QD (3 × 10⁻⁵ M in PBS buffer) for 4 h. (b) Fluorescence image of HEK 293 cells directly labelled by PbS-SA-biotin QD (3 × 10⁻⁵ M in PBS buffer) for 4 h, green channel, scale bar 100 µm. (c) Fluorescence image of HEK 293 cells directly labelled by PbS-SA-biotin QD (3 × 10⁻⁵ M in PBS buffer) for 4 h, red channel, scale bar 100 µm.

