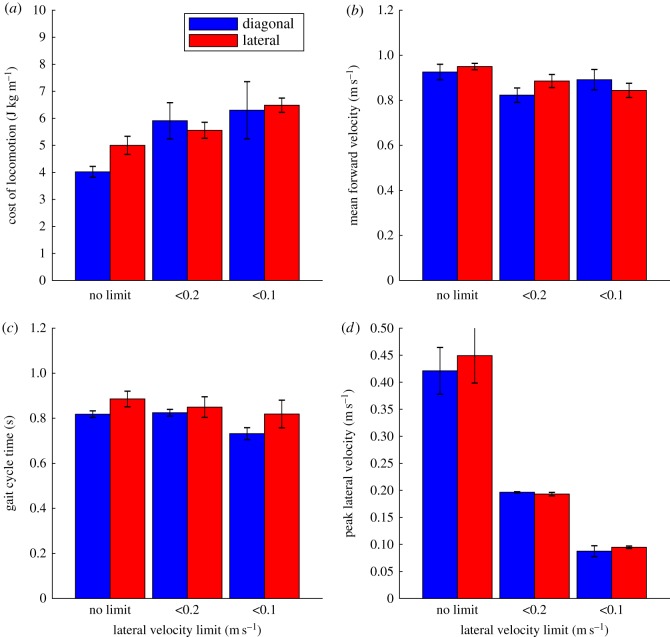
Figure 5.
Charts showing major performance parameters for the locomotor bouts generated with different starting footfall starting conditions and under different lateral velocity limits. (a) Cost of locomotion; (b) mean forward velocity; (c) gait cycle time; (d) peak lateral velocity. The bars show the mean values of each case and the error bars represent the standard errors.

