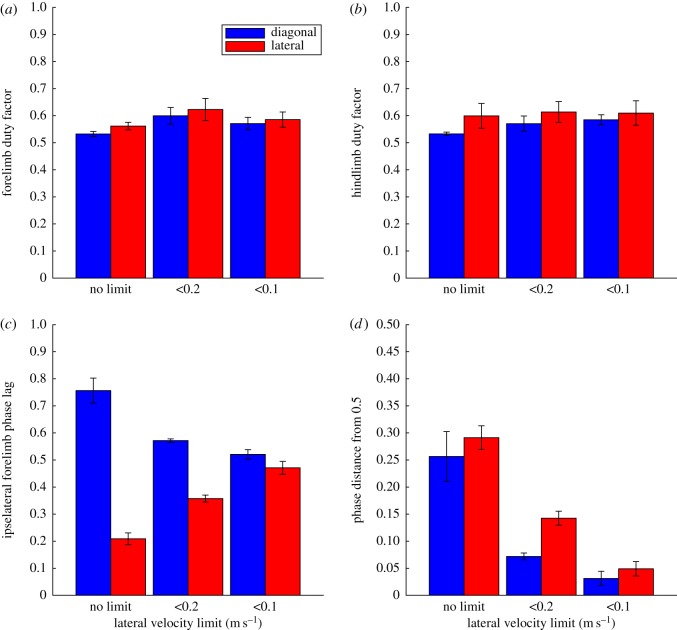
Figure 6.
Charts showing the phase and duty factor parameters for the locomotor bouts generated with different starting footfall starting conditions and under different lateral velocity limits. (a) Forelimb duty factor; (b) hindlimb duty factor; (c) phase lag between hind and forelimb touchdown on the same side; (d) phase lag measured as the absolute difference from the trot condition. The bars show the mean values of each case and the error bars represent the standard errors.

