
Figure 5.
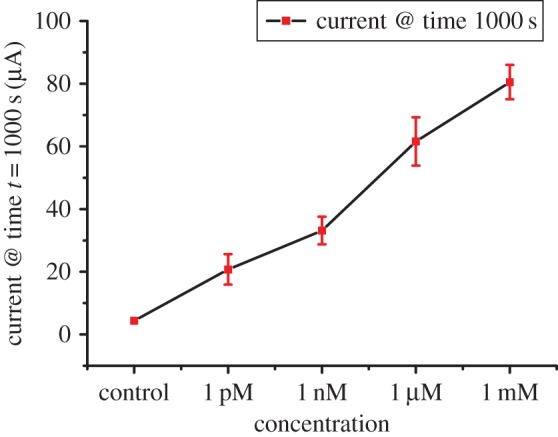
Plot of average current measured at t = 1000 s between three devices versus the urea concentration of the samples. The current measured increased linearly with analyte concentration. Devices tested for analyte concentration of 1 mM, 1 µM, 1 nM and 1 pM showed a maximum variation of 5.5%, 7.7%, 4.4% and 4.8%, respectively.