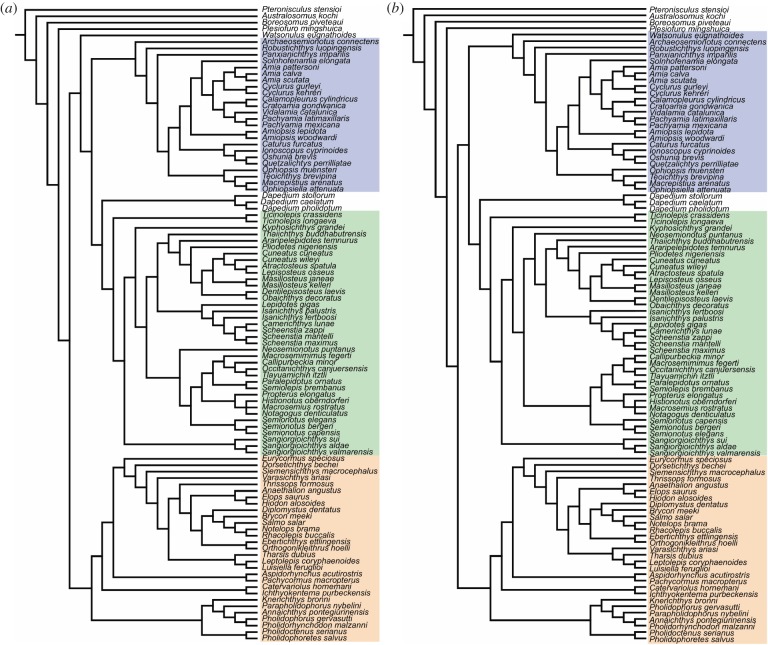
Figure 9.
Single most parsimonious trees of the analyses with implied weights with constraints. (a) Strong K-value of 3; (b) moderate down-weighting K-value of 8. Halecomorphi is highlighted in blue, Ginglymodi in green and Teleostei in orange. Bremer and bootstrap values for these trees are available in electronic supplementary material, file S3.

