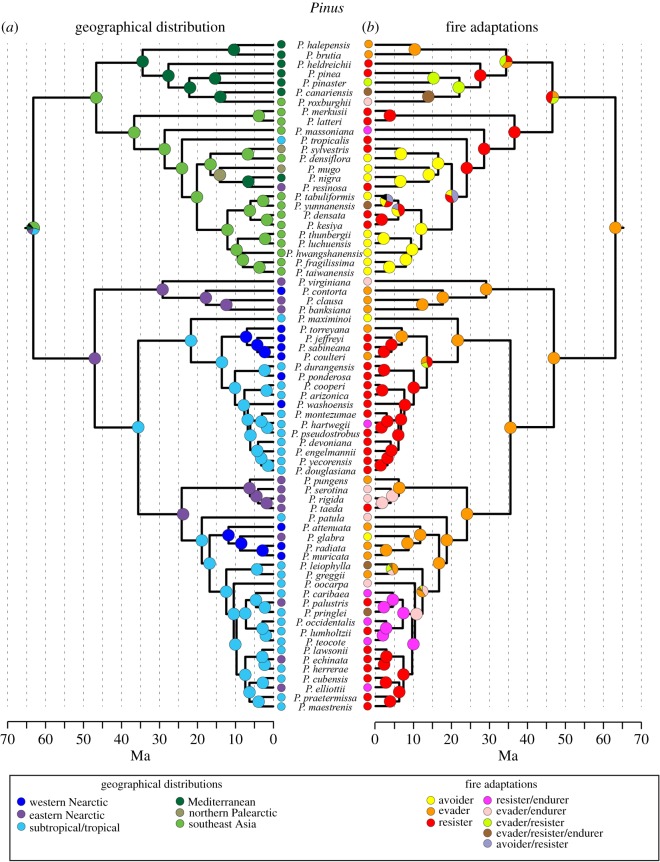
Figure 2.
The phylogenetic tree for subg. Pinus. Panel (a) represents the reconstructed ancestral locations; (b) represents the reconstructed ancestral fire syndromes. Solid coloured circles represent nodes where Bayesian posterior probability for ancestral location or fire syndrome was greater than 0.5.

