Fig. 2.
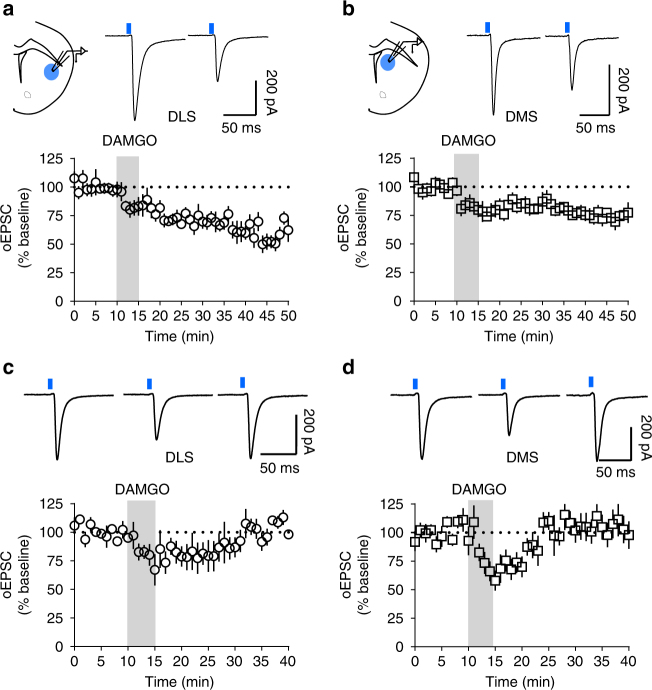
mOP-LTD occurs at corticostriatal but not thalamostriatal inputs. a Schematic of coronal brain slice showing the recording of oEPSCs by wide-field light stimulation (470 nm) in DLS of Ai32-Emx1Cre+ mice. mOP-LTD of cortical inputs occurs after the application of DAMGO (0.3 μM, 5 min) (n = 8 from 7 mice). b Schematic of coronal brain slice showing the recording of oEPSCs in DMS. mOP-LTD occurs in cortical inputs to DMS MSNs (n = 9 from 5 mice). c, d Activation of MORs (DAMGO 0.3 μM, 5 min) at thalamic inputs in Ai32-Vglut2Cre+ mice produces mOP-STD in the DLS (n = 7 from 3 mice) and the DMS (n = 6 from 2 mice). Data represent mean ± SEM. Traces in a, b represent average baseline oEPSCs and post-DAMGO oEPSCs. Traces in c, d represent average baseline oEPSC, average peak DAMGO inhibition oEPSC (14–19 min), and final 10 min after DAMGO average oEPSC

