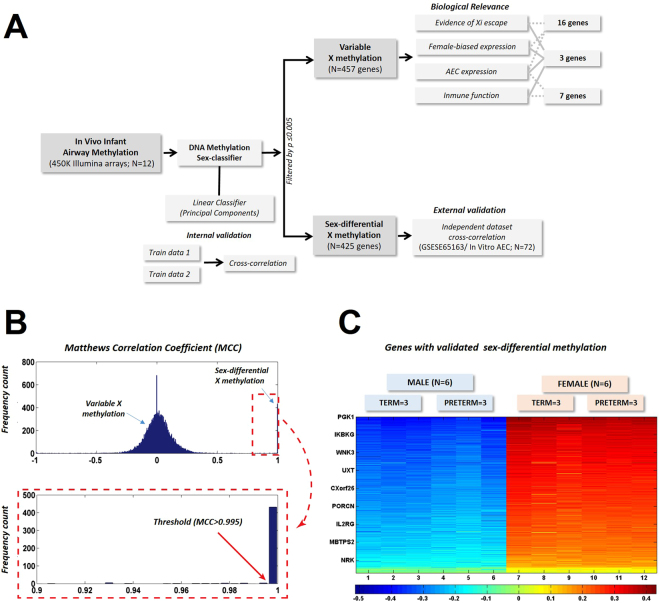
Figure 2.
Work Flow of Study. (A) Nasal airway genes were divided into those with sex-differential or variable X-chromosome methylation. (B) Histogram of the Matthews Correlation Coefficients shows a discernible cluster of X-linked genes above 0.995 (zoom on image). (C) Heatmap showing within-group similarity (clustering) of subjects (male or female) but not within term and preterm (n = 425 genes). Color key represents eigen-projections of each methylation pattern (per gene) on the PCA feature corresponding to the largest eigenvalue on the zero-mean, normalized methylation patterns.

