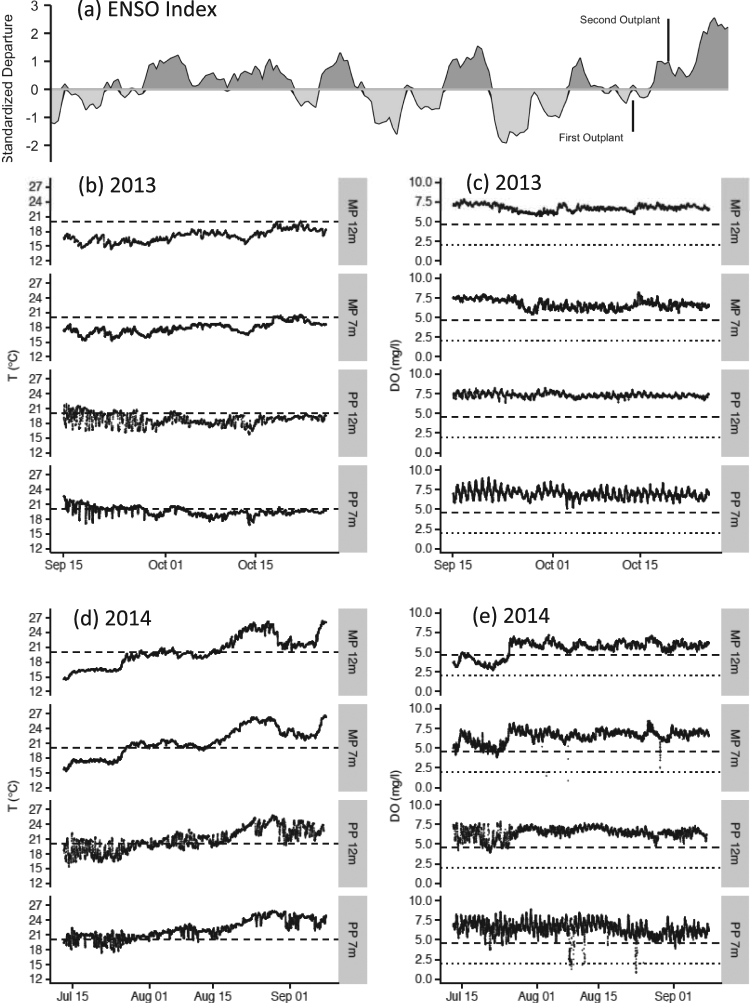
Figure 2.
Climate and local oceanographic conditions during the in situ abalone experiments. (a) Recent NOAA estimates of ENSO oscillations (from https://www.esrl.noaa.gov/psd/enso/mei/table.html). Initial times for both abalone outplants are indicated on the index. (b,d) Sep. – Oct. 2013 and July – Sep 2014 time series of seawater temperature (°C) at the 4 abalone outplant locations. Dashed black lines represent the 20 °C temperature reference used to derive the Temperature Index (TI). (c,e) Sep – Oct 2013 and July – Sep 2014 time series of dissolved oxygen concentration (mg/l) at the 4 outplant locations. Long dashed black lines represent the sub-lethal levels of dissolved oxygen (4.6 mg/l) used to derive the Oxygen Index (OI). Short black dashed lines represent the approximate lethal levels of dissolved oxygen (2.0 mg/l) reported in literature for many marine invertebrates (Vaquer-Sunyer and Duarte, 2008). For panels (b–e), labels on the right side of the panels indicate the location and depth of the sensors. MP = Morro Prieto; PP = Punta Prieta.

