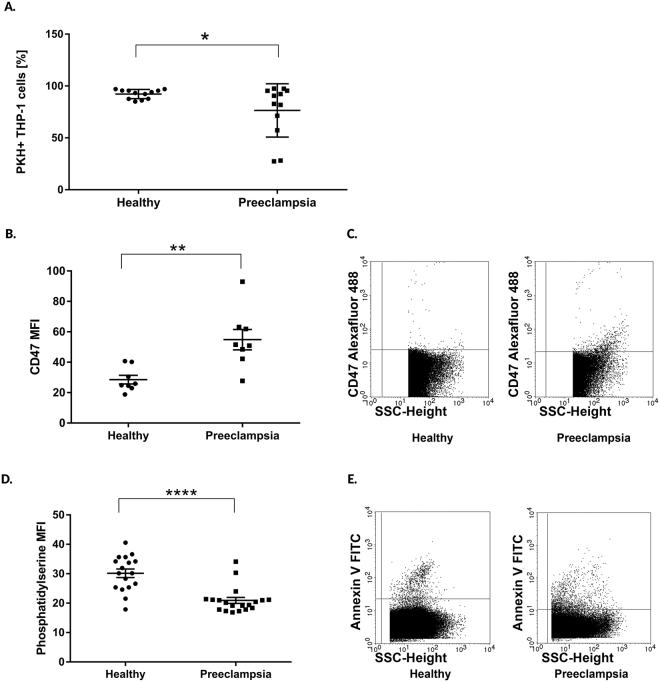
Figure 1.
Phagocytosis of circulating extracellular vesicles by THP-1 monocytic cells. (A) Blood plasma 12.5 K fraction of EVs were labelled with PKH dye and their phagocytosis by THP-1 cells was quantified by flow cytometry. (B) Exofacial expression level of CD47 on EVs. (C) Representative dot plots of CD47 expression (D) Expression level of phosphatidylserine on circulating EVs. (E) Representative dot plots of Annexin V positive vesicles. The statistical analysis is based on two-sided Student’s t-test. ***p < 0.001, **p < 0.01, *p < 0.05. All data presented is expressed as mean ± SEM.

