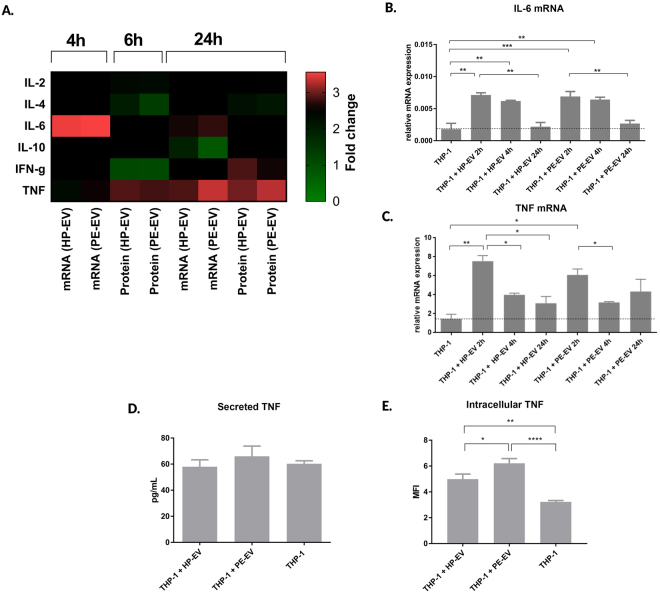
Figure 3.
Cytokine mRNA and protein levels upon EV treatment. (A) Heatmap of THP-1 cells cytokine expression at mRNA and protein levels after 4, 6 and 24 hours of 12.5 K fraction of EV incubation with THP-1 cells. (B) IL-6 mRNA expression upon 12.5 K fraction of EVs treatment. (C) Secreted TNF expression levels in EVs treated cells as determined by a cytometric bead assay. (D) Intracellular TNF content was quantified after 24 hours of 12.5 K fraction of EVs incubation by flow cytometry measurement. Data is expressed in mean fluorescence intensity (MFI). Mann-Whitney U test; ***p < 0.001, **p < 0.01, *p < 0.05. Bars illustrate mean ± SEM.

